
Market Recap 02/9/25
U.S. stocks ended the week lower as uncertainty over tariffs weighed on sentiment. While major indexes declined, the S&P 500 held up relatively well, slipping just 0.2%. Markets opened sharply lower following Trump's announcement of 25% tariffs on imports from Mexico and Canada and 10% levies on Chinese goods, set to take effect on February 1. However, by Monday's close, Trump postponed tariffs on Mexico and Canada for 30 days, helping stocks recover some early losses.
Earnings season also influenced sentiment, with 77% of S&P 500 companies that have reported Q4 results exceeding consensus earnings expectations, averaging 16.4% growth (vs. 11.9% projected). Additionally, 63% have surpassed sales estimates.
On the macroeconomic front, U.S. manufacturing activity expanded for the first time in 27 months, while the labor market showed signs of gradual cooling. Weaker-than-expected employment data helped drive demand for U.S. Treasuries, pushing yields lower across most maturities.
Treasury Secretary Scott Bessent says Trump 2.0 focusing on 10Year T Bond yields, not Fed. Bessent repeated his view that expanding energy supply will help lower inflation. For working-class Americans, "the energy component for them is one of the surest indicators for long-term inflation expectations," he said.
Globally, the pan-European STOXX 600 Index rose 0.6%, while Hong Kong's Hang Seng Index surged 4.5%, marking its best week in four months, fueled by gains in technology stocks. Gold climbed to another record high, while cryptocurrencies ended the week lower.
Tariff Uncertainty weighs on Stocks as bond yields drop
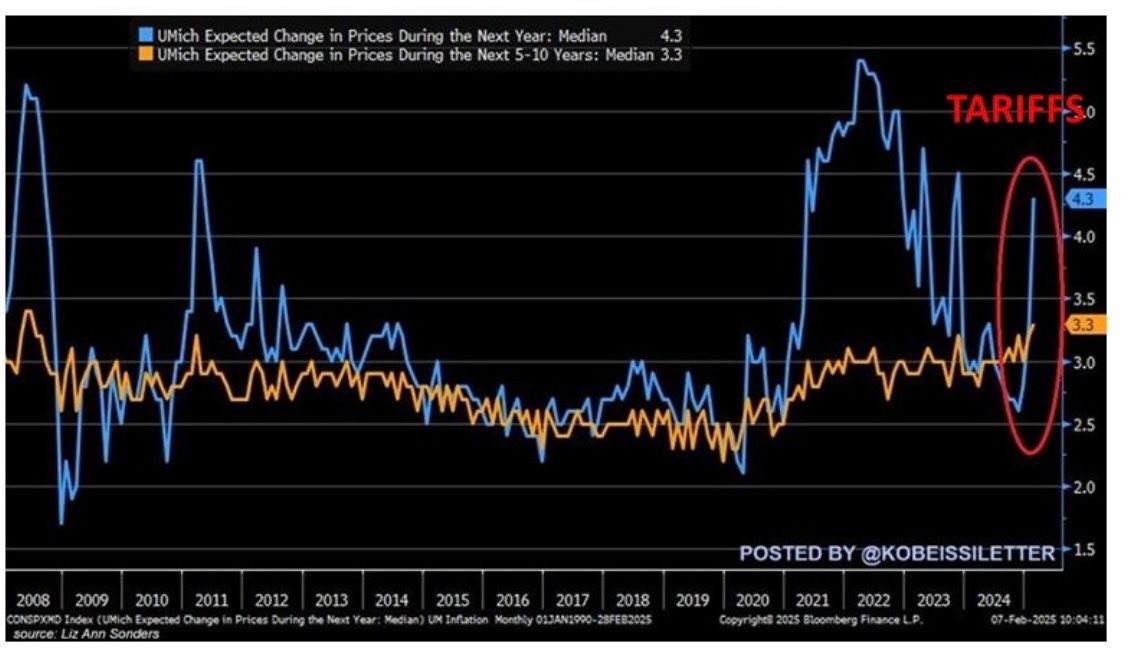
U.S. consumers' 12-month inflation expectations have jumped to 4.3%, the highest level since November 2023. This marks a sharp 1.7 percentage point increase over the past three months—the most significant surge since February 2020—and far above the expected 3.3%. Additionally, 5-10-year inflation expectations climbed to 3.3%, the highest since June 2008, surpassing forecasts of 3.2%. Inflation remains a pressing concern for most Americans.
Us Inflation Expectations Surge
Historic Market Valuations
Market valuations have reached record highs, considering multiple valuation methodologies.

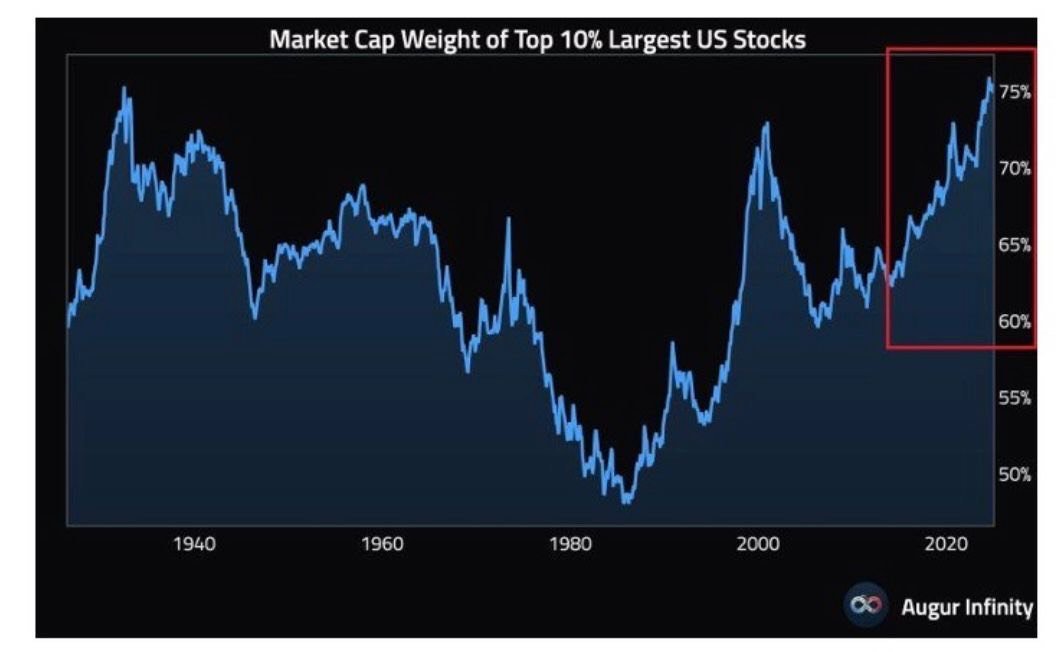
The top 10% of the largest U.S. stocks now account for an unprecedented 75% of total market capitalization, surpassing even pre-Great Depression levels. During the Dot-Com Bubble peak (2000), the share was slightly lower at 73%.
Extreme Market Concentration
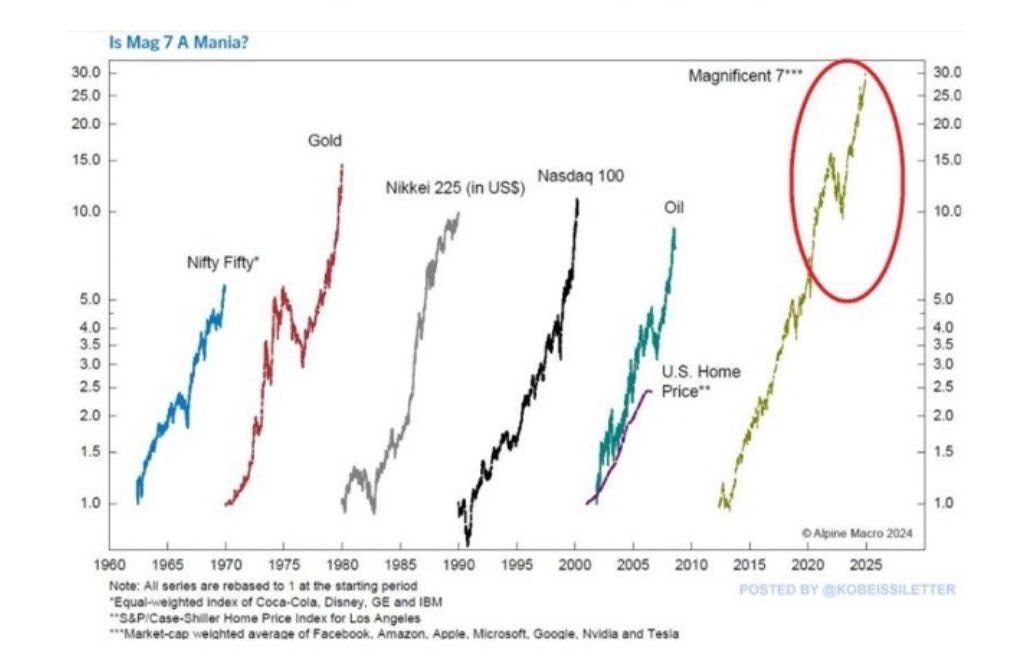
The Magnificent 7 stocks are now 30x higher than a decade ago, outpacing previous market bubbles:
Nasdaq 100 (Dot-Com Bubble, 2000): 12x increase over 10 years.
Nikkei 225 (Japan, 1980s): 10x increase.
Gold (1970s): 15x increase before peaking.
Nifty Fifty (1960s): 5x increase before the bull market ended in 1969.
Can AI sustain these historically high valuations?
A Bubble or the NExt Best Thing?
U.S. technology equity funds saw $7 billion in inflows last week, one of the largest in 14 months. Net positioning in mega-cap tech stocks remains at historically extreme levels.
Fear of Missing Out (FOMO) Drives Tech Surge

Leverage Mania
Trading volume in leveraged ETFs has surged, reflecting heightened risk appetite.

A key question looms: Will policymakers sacrifice equity markets to stabilize bond markets?
Will the U.S. Crash Stocks to Save Bonds?

Yield Curve Flattening
The yield curve saw a dramatic flattening this week, signaling economic uncertainty.


in 2024, the U.S. added $2.2 trillion in public debt to generate $570 billion in GDP growth. This equates to $3.9 of debt for every $1 of economic expansion.
U.S. Growth Fueled by debt
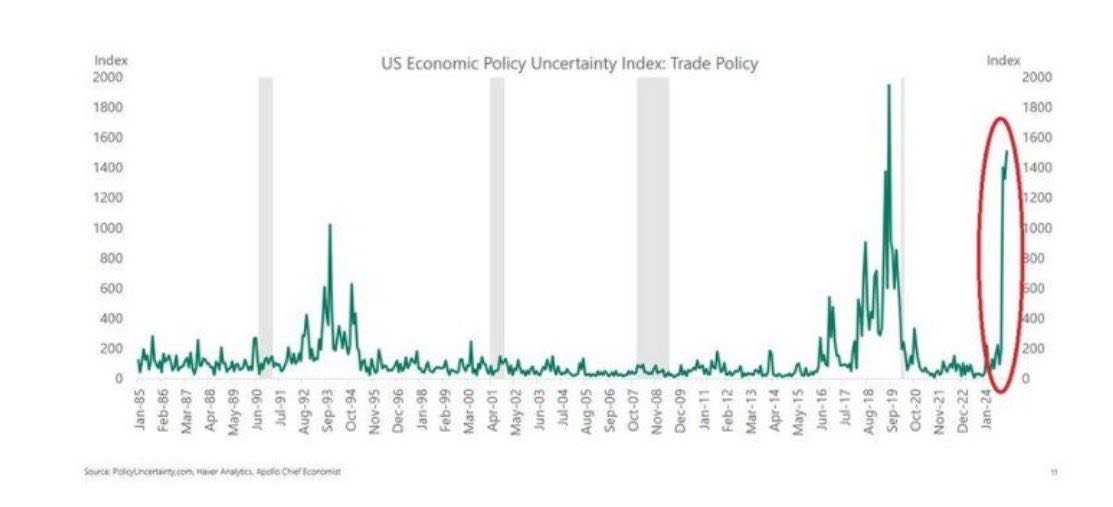
The Economic Policy Uncertainty Index is surging, indicating a more unpredictable investment environment and heightened market volatility, the highest level since the 2018 trade war.
U.s. Policy Uncertainty Spikes
In 2024, it took $3.8 of national debt to generate $1 of GDP growth.
Q4 2024 alone required $5.8 of debt per $1 of growth.
Without this borrowing, the U.S. economy would have been in a recession.
debt Bubble driving the economy

Canada & Mexico Strategic moves
Geopolitical and Market Realities. Recent events illustrate why both Canada and Mexico immediately conceded economically.

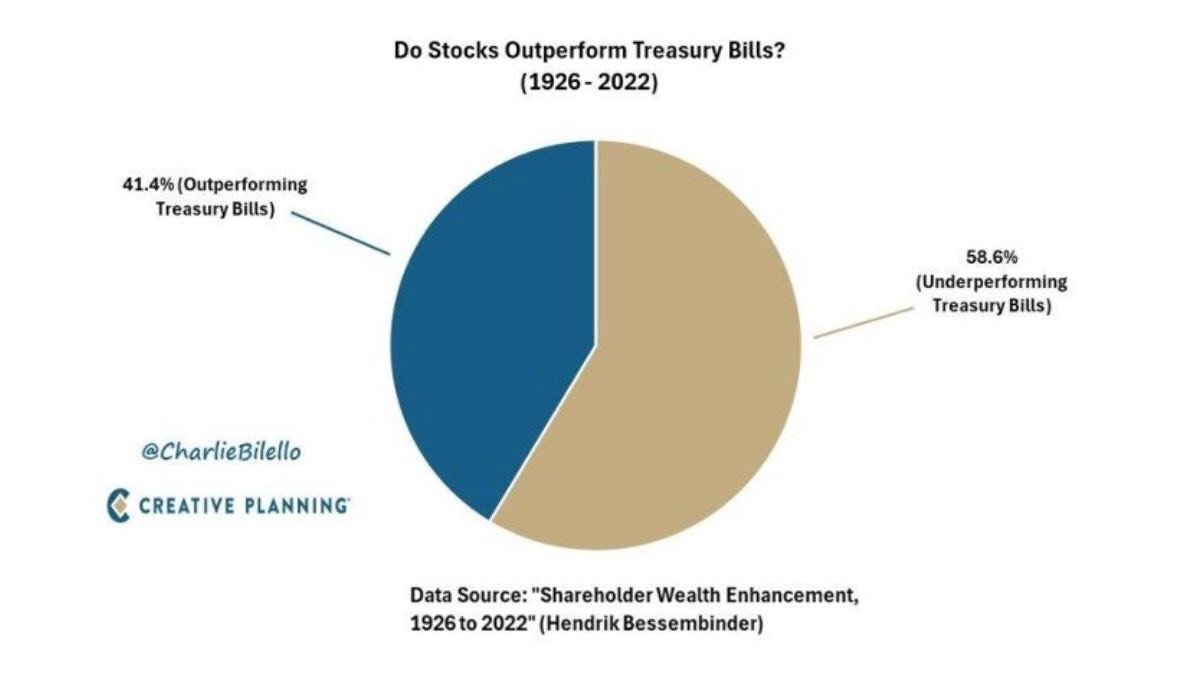
Historically, 95% of stocks have underperformed Treasury bills over their lifetime, with over half delivering negative cumulative returns.
Jack Bogle's advice - "Don't look for the needle in the haystack. Just buy the haystack."
stock performance vs. treasury bills
Market Recap 01/11/25
U.S. equities declined last week, with small-cap stocks underperforming large caps for the fifth time in six weeks, as the Russell 2000 Index slipped into correction territory. Value stocks fared better than growth stocks, while the Nasdaq Composite posted its steepest weekly drop since mid-November, falling 2.34%.
The week began positively, driven by reports suggesting a softer tariff stance from the incoming Trump administration. However, optimism faded as President-elect Trump dismissed these reports, and economic data reignited inflation concerns. On Friday, a blowout jobs report revealed the U.S. economy added 256,000 jobs in December, far surpassing expectations of 155,000. The data sent stocks sharply lower and solidified weekly losses across major indexes.
U.S. Treasury yields rose throughout the week, with the benchmark 10-year yield hitting its highest intraday level since November 2023 following the payroll report. In addition, 10-year Treasury auction yielded 4.68%, the highest level since 2007.
In commodities, oil surged on Friday, supported by new Russian sanctions and colder weather. The pan-European STOXX Europe 600 Index gained 0.65% for the week, while Japan’s Nikkei 225 fell 1.8%. Despite a strong U.S. dollar, gold rebounded to near $2,700, and Bitcoin remained volatile, testing the $91,000 level.
Good Macro News Spells Trouble for Bonds and Stocks
BoA (Hartnett): “U.S. Treasuries are entering the 6th year of the 3rd Great Bond Market of the past 240 years due to global shift to populism, rising U.S. government debt, inflationary central banks. Recession and/or default needed to reverse the secular bond bear of the 2020s.
U.S. Treasuries entering the 6th year of the 3rd Great Bond Market


Breadth is critical, and the current state of equities is concerning. This chart shows the percentage of stocks outperforming the S&P 500, which has hit all-time lows. In other words, concentration risk—measured this way—now surpasses the lows seen in 2000.
Equity Breadth Hits Record Lows
S&P 500 Dividend Yield Falls to 23-Year Low

The S&P 500’s dividend yield has dropped to 1.27%, matching Q4 2021 as the lowest level since 2000.
Goldman Sachs reports that U.S. valuations are at a 20-year peak, even when excluding the largest technology companies.
U.S. valuations are at a 20-year peak

China Enters Bear Market as MSCI Index Drops 20%
China has officially entered a bear market, with the MSCI China Index plunging over 20% from its recent highs and now testing the 200-day moving average.

Record-High Correlation Between U.S. Stocks and Bonds

The correlation between U.S. stocks and bonds over the past three years (0.73) is the highest ever recorded.

Inflation expectations are surging, with the 10-year breakeven rate reaching its highest level since October 2023.
Surging inflation expectations
Widest gap between 30-YEAR TREASURY AND S&P 500 YIELDS

The U.S. 30-year Treasury now yields 366 basis points more than the S&P 500, marking the widest gap since 2004.
UK 10-YEAR YIELDS reach the highest level since august 2008
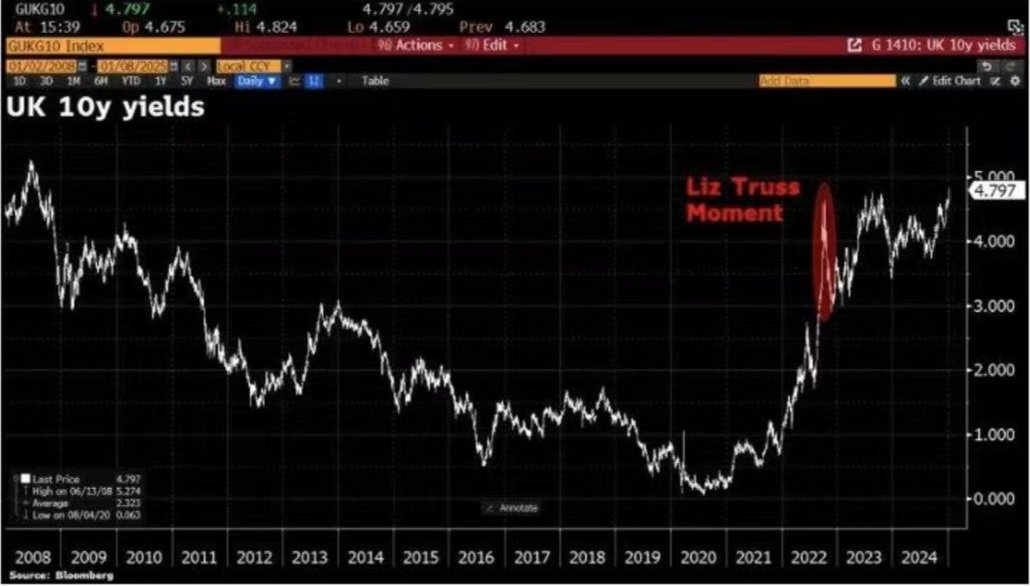
UK 10-year yields climbed by as much as 14 basis points to reach 4.82%, the highest level since August 2008.
Consumer credit card debt has just experienced its steepest drop since the onset of COVID—historically a concerning signal that often precedes or coincides with deep recessions. According to the Fed’s latest consumer credit data, U.S. household credit in November fell by $7.5 billion to $5.102 trillion, representing a 1.8% annualized contraction—a trend typically seen during significant economic downturns.
deepest drop of consumer credit card debt since covid

Stock-picking hedge funds have posted their highest average returns since 2020, according to Goldman Sachs. In 2024, global hedge funds achieved their best average returns, with a weighted average of 12.75%, while gross leverage increased to 190%, compared to the S&P 500’s 20% rise. Systematic equity funds led the pack, generating a 20% return through the use of algorithms.
Stock-Picking Hedge Funds See Best Returns Since 2020

Market Recap 11/03/24
The Nasdaq Composite hit record intraday highs on Wednesday before a sharp drop on Thursday. Over the week, growth stocks generally trailed behind value shares, while small-caps performed better than large-caps. About 42% of the companies in the S&P 500 Index reported Q3 earnings, including five of the “Magnificent 7.” Microsoft and Apple saw the largest losses, while Amazon and Google posted gains.
Earnings Drive Stocks Lower
On the economic front, the Labor Department reported a modest increase in nonfarm payrolls, with only 12,000 jobs added—the smallest since December 2020. This figure included a 44,000-job decline from the Boeing strike. Friday’s data also showed the ISM manufacturing index declining for the seventh consecutive month to 46.5, its lowest in 15 months.
Weakening Economic Data
Despite weak economic data, the yield on the 10-year U.S. Treasury note reached a four-month intraday high of 4.37% on Friday. In Europe, the STOXX Europe 600 Index fell 1.5% despite the eurozone’s 0.4% GDP growth in Q3 (above the 0.2% forecast). Japan’s stock markets rose, with the Nikkei 225 up 0.4% and the broader TOPIX up 1.0%, as the Bank of Japan held rates steady amid political uncertainties. Gold retreated after hitting a record high, oil prices fell over 3%, and Bitcoin surged past $73,000 before settling below $70,000 on Friday.
U.S. Treasuries, Global Equities, Oil, and Bitcoin
This market is among the most overvalued in history. Bank of America’s analysis indicates that the S&P 500 is costly across 19 of 20 metrics, with some like the Shiller Price-to-Earnings ratio (CAPE) exceeding historical averages by over 100%.
AN Overvalued Market

Within the S&P 100’s largest companies, 25 are trading at more than 50 times reported earnings, while none are trading below 10 times earnings.
High Valuations in S&P 100


Market euphoria is high. Asset managers’ net long positions on S&P 500, Dow Jones, and Nasdaq futures are now at their second-highest level in 15 years, just below 2021 levels before the 2022 bear market
HIGH MARKET EUPHORIA
Earnings for the S&P 500 have been underwhelming. Only 75% of companies exceeded Q3 earnings expectations—the lowest rate since Q4 2022—even with substantial earnings downgrades in September.
Underwhelming Earnings for S&P 500

HIGHEST 10-year Treasury yield since july
The 10-year Treasury yield has jumped to 4.37%, its highest since early July.

Another weak U.S. Treasury auction took place yesterday, pushing yields higher despite a 6% drop in oil prices. Bond yields are now more influenced by deficits, high government spending, and substantial Treasury auctions than by economic strength or weakness.
Weak Treasury Auction Drives Yields Higher
Significant Downward Revisions in Jobs Data
The Labor Department revised the last two jobs reports downward by a combined 112,000 jobs. September’s initial addition of 254,000 jobs was revised down by 31,000 to 223,000, and August’s jobs report was lowered by 81,000, from 159,000 to 78,000. Eight of the last 11 reports have seen similar downward adjustments, totaling nearly one million jobs over two years.

Escalating Fiscal Imbalance in 2024
In fiscal year 2024, the U.S. spent $1.83 for every dollar it earned.

U.S. sovereign risk surged

Since the Fed cut rates, U.S. sovereign risk has surged.

China’s industrial profits have fallen to the lowest levels since the COVID crisis. Large companies saw profits drop 27.1% year-over-year in September, following a 17.8% drop in August, signaling deep economic issues.
China’s Industrial Decline

With oil at $68, Russia’s FX reserves are at near-record highs, while foreign debt in USD is at a 12-year low.
Russia’s ECONOMY Resilience
Lastly, U.S. military spending accounts for 50% of global defense spending. Despite its issues, the dollar remains the world’s reserve currency, holding dominance as a medium of exchange. This is due to: (1) the U.S.’s growing share of global GDP (now 25%), (2) trust in U.S. rule of law, (3) the quality of U.S. assets, (4) the U.S. as a net exporter of oil and LNG, and (5) its share of global defense spending.
U.S. Military Spending and Dollar Dominance

Market Recap 10/27/24
The S&P 500 Index declined after six consecutive weeks of gains, weighed down by increasing Treasury yields. Large-cap stocks held up better than small-caps, with growth stocks outperforming value as the Nasdaq Composite Index saw a modest gain. Tesla led the S&P 500, helping to limit further losses, as it posted stronger-than-expected quarterly earnings, and Elon Musk projected solid sales growth for 2025. The stock recorded a significant 22% daily gain on Thursday, its highest in over 11 years. Conversely, Apple faced pressure as Wall Street analysts downgraded their ratings on the stock.
Stocks End 6-Week Winning Streak Amid Rising Treasury Yields
US Economic Data Surpasses Expectations
U.S. economic data continues to outperform forecasts, signaling that the Fed may not need to implement further rate cuts, as reflected in bond market activity. Yields rose since the Fed’s recent shift to a more dovish stance.
10-Year U.S. Treasury Yield
In fixed income, the 10-year U.S. Treasury yield climbed approximately 10 basis points on Monday to 4.20%, holding near that level throughout the week. A mix of high U.S. fiscal spending, Treasury issuance, and robust economic data fueled a sell-off in long-term Treasuries.
The STOXX Europe 600 Index fell 1.18% in Europe, while in Asia, Japan’s Nikkei 225 Index dropped 2.74%, and China’s Shanghai Composite Index rose by 1.17%.
International Equities
Gold rallied for the sixth time in seven weeks, reaching a new intraday high. Silver reached its highest price in over 12 years. Oil prices rose, with WTI crude trading between $70 and $72. The U.S. dollar saw its fourth consecutive weekly gain, reaching its highest close since June. Bitcoin remained volatile, ending the week below $67,000.
Gold, Oil, US Dollar, Bitcoin

Back to “Extreme Greed”
A BRICS summit held in Kazan highlighted projections that BRICS nations could outpace G7 countries in global economic contributions from 2024-2029, with a projected 44.3% contribution compared to the G7’s 20.1%. The summit saw 159 out of 193 countries sign onto the new BRIC settlement system, aimed at reducing dependency on the U.S. dollar and limiting the influence of U.S. and EU sanctions. Currently, 34 nations are sanctioned by the U.S., representing a third of the global population and 22% of global GDP. The new system enables transactions in local currencies, reducing reliance on the U.S. dollar.
BRICS Summit in Kazan, Russia

VIX Volatility: The VIX saw significant fluctuations, ending above 20 this week

Banking Sector Challenges
• FDIC Warning: The FDIC announced that 66 U.S. banks are at risk of insolvency.


• Unrealized Losses: U.S. banks face $515 billion in unrealized losses—seven times the level during the 2008 crisis.
US Public Debt Growing Challenge
• Interest Payments: U.S. debt interest payments now total nearly $1.2 trillion annually, consuming around 23% of total tax revenue.


• Rising National Debt: The U.S. national debt surged by $850 billion in the past three months.

S&P 500 valuations are at levels reminiscent of the 2000 dot-com bubble, with the Price-to-Book ratio now at 5.2X, the highest on record. Excluding the Magnificent 7 stocks, the ratio stands at 4.2X, near historical peaks.
S&P 500 Valuations
Market Recap 10/20/24
U.S. equities posted another week of gains, with banks leading the charge. Energy stocks, however, pulled back in response to falling oil prices as concerns over potential Israeli attacks on Iran’s oil and gas infrastructure eased. Small-cap stocks in the Russell 2000 and S&P MidCap 400 outperformed large-cap indices. After lagging earlier in the week, the Nasdaq Composite rallied on Friday, driven by strong quarterly results from Taiwan Semiconductor Manufacturing, which boosted AI-related stocks. Netflix also provided a boost, exceeding expectations with subscriber growth and improved operating margins in Q3.
Despite the dollar’s rise to July levels, gold surged above $2,700, setting a new record, and Bitcoin hit $69,000. Both assets appear to be benefiting from increasing odds of a Trump victory and a Republican sweep.
Bullion, Bitcoin, and Banks Surge as Trump’s Win Odds Increase
On the macroeconomic front, U.S. retail sales and weekly jobless claims surpassed forecasts, while industrial production fell by 0.3% in September, following a 0.3% increase in the previous month. U.S. Treasury yields ended the week relatively flat, with long-term yields slightly outperforming. In Europe, the ECB and Bank of England both cut rates as anticipated, while inflation figures for September came in lower than expected. The STOXX Europe 600 Index rose 0.58%, while Japan’s Nikkei 225 Index fell 1.58%. China’s Shanghai Composite Index gained 1.36% as the central bank introduced additional support measures.
Mixed MACROEconomic Data
The equity put-to-call ratio has dropped to 0.44, the lowest since July 2023 and March 2022 before that. In other words, investor demand for hedging against a stock market decline is at its weakest in years, despite October historically being the worst month for stocks during Presidential Election years. Meanwhile, the S&P 500 has reached 45 all-time highs this year and is up 23% year-to-date. The resilience of the market is striking.
Weak Hedging Demand Amid Market Strength

For the first time in 22 years, U.S. bonds are yielding more than stocks. The S&P 500 earnings yield (earnings/price) fell to 3.8% in October, below the 10-year U.S. Treasury yield of 4.1%. The last significant gap like this, in early 2000, signaled an exit from stocks.
U.S. Bonds Yield More Than Stocks for the first time in 22 years


Wondering why U.S. stocks have rallied so strongly this year? A key factor is record-high share buybacks. U.S. share repurchase authorizations have hit $988 billion, the highest on record—three times higher than in 2020 and up 21% year-over-year.
Record-high Share Buybacks Fuel U.S. Stock Rally
The number of “zombie companies” in the U.S. is surging. Currently, 43% of Russell 2000 companies are unprofitable, the highest since the COVID-19 crisis. At the same time, interest expense as a percentage of total debt for Russell 2000 firms has reached 7.1%, the highest since 2003.
Growing numbers of “zombie companies” in the U.S.

Chinese stocks slumped into a correction

Chinese stocks have entered a technical correction, dropping more than 10% from their October 8th high.
Global recession fears are minimal, with only 8% of investors in the BoA survey expecting a hard landing for the global economy within the next 12 months, the second-lowest reading in two years. A notable 76% expect a soft landing, according to a survey of 195 participants managing $500 million in assets.
HIGH EXPECTATION of a SOFT LANDING

China’s Debt-to-GDP Ratio Hits Record High
If you think the U.S. is the only over-leveraged economy, think again. China’s debt-to-GDP ratio hit a record 366% in Q1 2024, nearly doubling since 2008.

The US dollar’s share of global payments surged to 49% in 2024, its highest level since 2012, up from around 40% at the start of 2022. Meanwhile, the Euro’s share has dropped to approximately 21%. The anticipated decline of the US dollar doesn’t appear so imminent.
the strength of US Dollar

Market Recap 10/14/24
The S&P 500 and Dow Jones both reached all-time highs this week, driven by better-than-expected earnings reports. JPMorgan Chase and Wells Fargo saw stock gains on Friday after reporting smaller-than-anticipated drops in Q3 profits. Growth stocks, particularly NVIDIA, outperformed value stocks, balancing out declines in Alphabet (Google’s parent) and Tesla, which dipped after lukewarm reactions to its new “robotaxi” and “robovan” unveilings.
Stocks Hit New Records as Earnings Season Begins
Strong earnings helped to offset weaker-than-expected economic data. Both headline and core inflation rose slightly more than anticipated in September, up 0.2% and 0.3% respectively. Additionally, jobless claims unexpectedly surged to 258,000, marking a 14-month high.
Mixed Economic Data
These economic indicators shifted expectations for the Federal Reserve’s November meeting, with futures markets now assigning a 14.1% probability that the Fed will hold interest rates steady.
Shift in Fed Rate Expectations
The 10-year US Treasury yield hit 4.12%, its highest level since July. The dollar strengthened for the second consecutive week but eased slightly on Friday. Despite the dollar’s rise, gold remained resilient, closing above $2,600. WTI crude oil climbed above $75. Bitcoin saw a dramatic recovery, rising from $59,000 to $63,000 by week’s end, reversing from near one-month lows.
Movements in US Treasuries, Dollar, Oil, Gold, and Bitcoin
Despite rising bond yields, stocks continue to hold their ground. The 2-year Treasury closed at 3.95%, up 37 basis points since the recent rate cut, while the 10-year yield reached 4.11% on Friday before settling at 4.09%, an increase of 45 basis points. However, the ongoing rise in yields raises questions about how long the stock market can maintain its rally.
Stocks Remain Strong Despite Rising Interest Rates
According to new Federal Reserve data, the number of people holding multiple jobs has reached a record high, with around 300,000 more workers than before the pandemic and 600,000 more than the 2008 peak. Additionally, part-time jobholders have surged by 3 million in the past three years, bringing the total close to 28.2 million. Food stamp usage has also climbed 34.6% since July 2023.
Multiple Jobholders and Part-Time Work on the Rise


Credit card interest rates have hit an all-time high of 23.4%, while total credit card debt has reached $1.14 trillion. For comparison, in 2018, Americans paid $160 billion in interest on their cards; today, that figure is $318 billion. Credit card delinquencies are rising, as are auto loan delinquencies, especially in both prime and subprime categories.
Record Credit Card Rates and Growing Delinquencies

1. The US government spends $7.9 trillion annually but generates only $4.4 trillion in revenue.
2. 80% of spending goes to healthcare, Social Security, the military, and debt interest.
3. Without major cuts to these areas, reducing the deficit will be challenging.
The US Debt Problem in Perspective

One chart clearly illustrates the divergence between Wall Street and Main Street, showing how the economic recovery has been uneven.
The “K-Shaped Recovery” Visualized

According to the AAII Investor Sentiment Survey, bearish sentiment among individual investors has fallen to its lowest level since Q4 2023
Bearish Sentiment Hits a Low

Market Recap 10/06/24
A robust U.S. jobs report helped counterbalance concerns over escalating tensions in the Middle East. On Friday, a strong U.S. Labor Department report revealed that 254,000 jobs were added in September—nearly double the consensus estimates—while August’s numbers were revised upward. The unemployment rate also ticked down to 4.1%.
Better than Expected Jobs ReporT
Despite geopolitical worries and a dockworkers’ strike at Eastern seaports, U.S. blue-chip stocks rallied on Friday, leading to a fourth consecutive weekly gain. Positive jobs report drove the Dow Jones up by 300 points to a new all-time high. The S&P 500 saw a sharp drop (-1.38%) on Tuesday after Iran launched nearly 200 missiles at Israel, with several striking the southern and central regions of the country. Despite threats of more severe retaliation if Israel responded, the worst-case scenario didn’t unfold, and markets stabilized by mid-week.
Stocks’ Continued Rally
The 10-year U.S. Treasury yield reached its highest intraday level (3.98%) since early August. The STOXX Europe 600 Index fell 1.80% for the week, and Japan’s Nikkei index dropped 3% following significant Monday losses. Chinese stocks surged, with the blue-chip CSI 300 Index gaining 8.48% and the Hang Seng Index climbing 10.2%, although gold ended the week slightly lower, and the dollar reached a new high. Crude oil surged about 9% week for its biggest weekly gain since March 2023.Bitcoin declined from 64,000 to 61,000. Avinash Shekhar, Co-Founder & CEO of Pi42, said, "The strong economic data along with tensions on the geopolitical front have strengthened the US dollar and thus impacted the prices of cryptocurrencies.”
US Treasuries, European & Chinese Equities, Gold, USD, Bitcoin
Extreme Greed Returns to the Stock Market

Extreme greed has resurfaced in the stock market for the first time since March.
Yield Curve Bear-Flattening
The yield curve (2s10s) bear-flattened significantly this week, moving close to inversion again.

The U.S. economy added 254,000 jobs in September, well above the forecasted 147,000. The unemployment rate dropped to 4.1%, beating the expected 4.2%. This marks the first time job numbers have exceeded expectations since May 2024. However, we will need to wait two months for revisions, followed by several more months for the final data.
Strong U.S. Job Growth in September

A striking statistic of the day: U.S. public debt has ballooned. In 2008, federal debt stood at $9.4 trillion, with a GDP of $14.7 trillion, resulting in a debt-to-GDP ratio of 64%. Currently, public debt has soared to $35.7 trillion, with the U.S. adding $345 billion in debt between September 27 and October 1 alone. With GDP now at $29 trillion, the debt-to-GDP ratio has reached 122%. What’s the tipping point for the bond market?
Rising U.S. Public Debt

What’s going on in Germany? Over the past two years, most economic data from the world’s third-largest economy has consistently fallen below economists’ expectations. Germany is on course for its second consecutive year of GDP contraction, marking the first time this has happened since 2003.
Germany’s Economic Struggles

September 2024 saw the most significant monetary easing since April 2020. Central banks globally lowered interest rates 21 times throughout the month, marking the largest number of cuts since the pandemic and the third-highest since the Financial Crisis.
Monetary Easing in September


A staggering chart: Global money printing is soaring. The global money supply surged by $7.3 trillion year-over-year, the most in three years, hitting a record $89.7 trillion. Since 2022, it has increased by $22 trillion, and since 2007, by a massive $63 trillion.
Soaring Global Money Supply
Unprofitable U.S. Small-Cap Companies
Approximately 42% of U.S. small-cap companies are currently unprofitable, levels reminiscent of the 2009 Great Financial Crisis. This figure was only higher during 2020 and 2021. Russell 2000 firms are carrying $382 billion in debt, and additional rate cuts may enable these “zombie” companies to survive.

And finally U.S. Government Financial Report - Revenues & Expenses ——-
The chart shows a net operating cost of $3.4 trillion, indicating a deficit in the government’s budget, meaning spending has significantly exceeded revenue.
U.S. Government Financial Report

Market Recap 09/29/24
The Dow Jones and S&P 500 hit record highs as investors reacted positively to new stimulus measures in China. Chemicals and materials stocks led the way, with copper prices rising. Tech stocks also outperformed, fueled by takeover rumors involving Intel and news that NVIDIA’s CEO had stopped selling shares. Micron Technology surged on an optimistic AI demand outlook, lifting the entire chip sector.
Continuing Record Highs in the U.S. Stock Markets
Chinese stocks surged, with the blue-chip CSI 300 jumping 15.7% after Beijing introduced measures to stimulate the economy. In Europe, the STOXX Europe 600 rose 2.69% amid signs of slowing business activity, sparking hopes for rate cuts. Japan's Nikkei 225 gained 5.6% over the week. Gold rallied for the third consecutive week, hitting new highs before a Friday pullback, while Bitcoin also climbed for a third week, surpassing $66,000.
China & Japanese Stocks, Gold, Bitcoin, Soaring for the Week
Inflation data gave markets an early boost on Friday. The Fed's preferred inflation gauge, the core PCE price index (excluding food and energy), rose just 0.1% in August, slightly below expectations. Year-over-year, it increased 2.2%, close to the Fed’s 2% target and the lowest since February 2021. US 10-year Treasury yields were relatively flat for the week.
Inflation Data ignited Stocks, UST Yields Unchanged
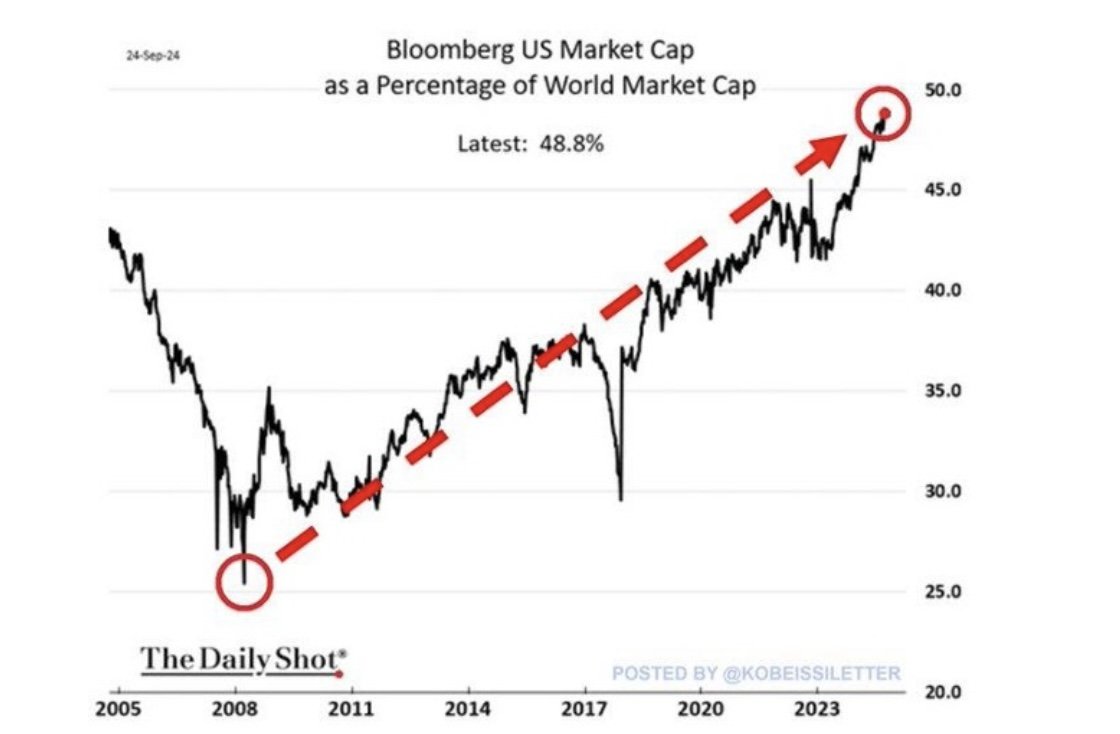
US stocks now account for a record 48.8% of the global market cap, nearly double the share from 15 years ago. The total value of US stocks is $57.4 trillion, double the US GDP, and three times larger than the market cap of major Asian and European exchanges. The S&P 500 has gained 21% year-to-date, hitting 41 all-time highs in 2024.
Remarkable Strength of the US stocks Continues
Despite market strength, American consumers are increasingly worried about the future. In September, 51% of consumers expressed uncertainty about business conditions in the next year, the highest percentage on record and double the figure from four months ago. Over the past 30 years, concern about short-term business prospects has never been this high, driven by soaring living costs, high borrowing rates, and a weakening job market.
Weakening of U.S Consumer Continues

Rising unemployment has historically preceded S&P 500 corrections. The US jobless rate increased from 3.4% in April 2023 to 4.2% in August, nearing a three-year high. Past periods of rising unemployment have been followed by significant declines in the S&P 500. Upcoming US jobs reports will be crucial.
Disconnect between Rising Unemployment & Stocks

The Richmond Fed Manufacturing Employment Index plunged 21 points in September, its lowest level since April 2009. The index has contracted for most of 2024, falling below pandemic levels. Expectations for employment over the next six months dropped to -12 points, the lowest since April 2020. Overall business conditions are now at their worst since May 2020, and the second lowest since 2008.
Disconnect between Contraction in Manufacturing & Stocks


US credit card interest rates have hit record highs, hovering around 22%. At the same time, credit card debt has surged to $1.14 trillion, also an all-time high. This means Americans are paying roughly $250 billion annually in interest on credit cards.
US Credit Card Debt still rising
The week begins with more negative news for Germany’s economy. S&P Global’s flash Purchasing Managers' Index (PMI) for Germany dropped to 47.2, its lowest in 7 months, and remains below the 50 threshold that separates growth from contraction. The manufacturing index fell to 40.3 from 42.4 in August, marking the weakest reading since September 2023, while the services index dipped to 50.6 from 51.2, its lowest since March 2024.
German Economy

Germany once relied on:
1. Affordable energy from Russia
2. Low-cost subcontractors in Eastern Europe
3. Consistently rising exports to China
Now, all three pillars have eroded. If this is the situation during relatively stable times, what will happen in the next recession.
Germany’s Economic Model
For those wondering about the global significance of Germany’s economy: as shown below, its decline will have widespread effects across Europe.
Germany and Its Importance

Americans are officially out of savings:
US net savings as a % of GDP by households, businesses, and the government have been negative for 6 consecutive quarters. In other words, Americans are producing much less than they consume. Since 1947, there were only two other times when savings were negative, in 2008 and 2020. This comes after the US government's deficit hit $2.1 trillion over the last 12 months with spending reaching $6.9 trillion. At the same time, the personal savings rate fell to 2.9%, the second lowest since 2008.
U.S. Savings at Crisis Levels

The chart below shows the two strongest and two weakest sectors of the dozens of job sectors as listed on indeed.com. The two job sectors with the strongest hiring are doctors (red) and therapists (blue). In other words, health care. Information design (green) and software development (orange) are the weakest sectors. Why are these the weakest? They are the most direct application of #AI. Large language models assisting in design and coding are killing these job prospects...
Coders be Aware


Inflation in the U.S?
Market Recap 09/22/24
US large-cap indexes hit new record highs as investors welcomed the start of what many anticipate to be a prolonged cycle of Fed rate cuts. The rally was broad, with small-cap indexes outperforming (the Russell 2000 index gained 9% for the week), though still below previous peaks. Initial reactions to the Fed’s large rate cut were subdued, but optimism took off on Thursday, driving the Dow Jones Industrial Average, S&P 500, and Nasdaq Composite to fresh highs.
Record Highs
The Fed’s 50 basis point rate cut this week was driven by several key factors:
1. The risk of inflation is considered lower than risks to employment and consumer spending.
2. Shelter costs, a persistent inflation driver, require more housing supply to ease. Lower mortgage rates—facilitated by a significant rate cut—are needed for this.
3. Lowering front-end rates is essential as the massive debt burden comes due.
Is It Justifiable?
Some argue that the Fed's aggressive move was premature, given upbeat economic data. The Commerce Department reported that retail sales grew by 0.1% in August, surpassing expectations, following an upwardly revised 1.1% gain in July. Building permits also surged 4.9%—their largest monthly increase in a year—reaching their highest level since March.
Reasons Behind the Jumbo Rate Cut
In response to the Fed decision, bond yields edged higher and credit spreads narrowed. The Bank of England kept rates steady, the dollar remained flat, oil prices rallied, gold reached an all-time high, and Bitcoin surged past $64,000.
Markets Response: Treasuries, Dollar, Oil, Gold, Bitcoin
Optimism is growing on Wall Street for a soft landing similar to 1995, but this hope often fades as economic realities set in. In the mid-1990s, the labor market was thriving, while today it is deteriorating rapidly.
Wall Street Hopes for a Repeat of 1995 US Soft Landing

U.S Restaurants Activities
The Restaurant Performance Index (RPI) dropped by 1.3% in July, falling to 97.7, its lowest since the 2020 lockdowns. This index measures the health of the US restaurant industry, including sales, customer traffic, labor, and business conditions. Since 2021, the RPI has declined by 8%, its sharpest fall since its inception in 2002, a level typically associated with recessions. As restaurant prices continue to soar, Americans are cutting back on dining out. Since 2020, the cost of food away from home has increased by 27%, with fast food prices up 31%, making eating out a luxury for many.
reasons to be concerned


US Housing Environment
Is the housing market at a turning point? The average interest rate on a 30-year mortgage has fallen from 7.8% to 6.2% in just a few months, yet mortgage demand remains at near 30-year lows, according to Reventure. Despite lower rates, buyers are hesitant to enter the market. It's likely that sellers will have to reduce prices to reignite demand.
US Public Debt
US interest expenses on public debt now exceed defense spending by $300 billion. Over the past year, the US government spent a record $1.2 trillion on interest payments, making it the second-largest expense, surpassing both defense and healthcare spending, trailing only Social Security.
Other CONCERNS

History also shows caution is warranted. The last two times the Fed made an initial 50 basis point rate cut:
- On January 3, 2001, the S&P 500 dropped nearly 40% over the next 448 days, while unemployment rose by 2.1%, leading to a recession.
- On September 18, 2007, the S&P 500 fell nearly 55% over the following 372 days, with unemployment climbing by 5.2%, also ending in a recession.
As for the rate cut on September 18, 2024:
- S&P 500: ?
- Unemployment rate: ?
- Recession: ?
will history repeat itself?

Market Recap 09/16/24
Stocks posted solid gains, largely recovering from the previous week’s sharp losses. Growth stocks significantly outperformed value stocks, driven by a strong rally in technology shares midweek after NVIDIA CEO Jensen Huang commented on "incredible demand." This momentum continued into Friday. On Wednesday, stocks initially dropped sharply following news that core inflation (excluding food and energy) rose by 0.3% in August, slightly above expectations. Meanwhile, headline inflation showed an annual increase of 2.5%, down from July’s 2.9% and marking its lowest level since early 2021. However, NVIDIA’s news helped fuel a recovery later in the day.
Losses Recovered, Growth Outperformed Value
In Europe, the STOXX 600 Index rose 1.85%, supported by an interest rate cut from the ECB. Japan’s stock markets showed mixed results, with the Nikkei 225 gaining 0.5%. In contrast, Chinese stocks declined as weak inflation data raised concerns about a deflationary price-wage spiral weighing on the economy.
Foreign Stock Markets
Treasury yields edged lower, with the 10-year Treasury note trading at year-to-date lows. The weakening dollar boosted gold, which hit a new record high and posted its best week in five months. Bitcoin also had a strong week, rising to its highest level in two months and testing the $60,000 mark.
Treasuries, Dollar, Gold, Bitcoin
Who is Right on the State of Economy?
Recession probabilities are diverging across asset classes. Treasuries and base metals are pricing in a recession, while other asset classes, such as stocks and credit, are not. Who’s right?

Are Rate Cuts Always Positive for Stocks?

Not necessarily—especially if they coincide with an economic downturn and declining earnings, as seen in 2007-2008.
High US Stocks Valuations by Most Metrics
We are currently in one of the most expensive markets in history. Valuations continue to be a headwind for U.S. equities, with valuation being the only negative factor out of the five pillars in our investment process. According to a Bank of America analyst, the S&P 500 is expensive by 19 of 20 metrics, with some metrics exceeding 100% above historical averages. The Shiller P/E ratio and the S&P 500 Market Cap-to-GDP ratio are 101% and 147% above their historical averages, respectively.

Are we witnessing the largest concentration bubble in history? The "Magnificent 7" stocks now make up 32% of the S&P 500, near an all-time high. This share has jumped by 10 percentage points in just 1.5 years, surpassing even the levels seen during the 2000 dot-com bubble.
Magnificent 7 to the Moon

U.S. small businesses are facing their toughest period since the Great Financial Crisis. The number of firms reporting rising profits has dropped to the lowest level since 2009, while those reporting declining earnings is the highest in 15 years. Small businesses, which account for 33 million firms and 44% of U.S. GDP, are struggling.
Small Businesses Struggling

Small Banks - Unrealized Losses Growing
U.S. banks’ unrealized losses reached $512.9 billion in Q2 2024, marking the 11th consecutive quarter of losses on investment securities—an unprecedented streak. The FDIC’s Problem Bank List now includes 66 banks, representing 1.5% of the total.

For the first time in 35 years, the spread between 2-year U.S. government bonds and the Fed’s rates has fallen to -1.686%, the lowest in over three decades. This suggests that the bond market expects significant Fed rate cuts soon. Is the bond market too optimistic, or is the Fed behind the curve?
Who is Right on Treasuries Spreads?


Global oil demand has fallen to its lowest level since the COVID crisis. World consumption increased by 800,000 barrels per day in the first half of 2024, only a third of the growth seen in the same period in 2023—the slowest pace since the 2020 demand crash.
Falling Global Oil Demand
The U.S. now has 510,000 more job openings than unemployed individuals, the smallest gap since April 2021, down from a peak of over 6 million in March 2022. The labor market is cooling rapidly.
Cooling Labor Market

Germany has significantly lagged behind the U.S. in economic growth over the past 30 years. Since 1980, the U.S. economy has grown tenfold, while Germany’s has only expanded fivefold. While population growth plays a role, Germany’s slower adoption of digitalization and technological transformation has contributed to its underperformance since the 1990s.
Economic Growth - Germany vs U.S.

Is China’s economy slowing down? According to the Financial Times, the number of startups in China has plummeted to just 260 in 2024, down from a peak of 51,302 in 2018. Additionally, venture capital fundraising has collapsed by 96% in just two years. China, once a top VC destination after the U.S., is losing its appeal.
Meanwhile, Chinese stocks have dropped to their lowest levels in 5.5 years. The CSI 300 index is down over 14% since May and nearly 50% since 2020, heading for its fourth consecutive year of losses due to weak earnings and a sluggish economy.
China’s Public Markets and Startups

The Restaurant Performance Index (RPI) dropped 1.3% in July, reaching 97.7 points, the lowest since the 2020 lockdowns. The RPI assesses the state of the U.S. restaurant industry by monitoring factors like sales, customer traffic, labor, and overall business conditions. Since 2021, the index has declined by around 8%, marking its steepest fall since its inception in 2002. Such low levels have historically only occurred during recessions. Rising prices are causing Americans to cut back on dining out, with food costs recently reaching record highs. Since 2020, food prices outside the home have risen 27%, while fast food prices have surged 31%. Eating out is increasingly becoming a luxury.
Source: The Kobeissi Letter, Trahan Macro Research.
IS DINING OUT A LUXURY?

Thank you for reading. Please feel free to leave any comments in our sign-up section.
The Beryl Consulting Group Editorial Team
Market Recap 09/08/24
Concerns about an economic slowdown weighed heavily on sentiment, as the S&P 500 posted its worst weekly performance since March 2023. Technology stocks led the declines, partly due to a drop in NVIDIA following rumors of a potential antitrust investigation by the Justice Department, which resulted in a roughly $300 billion decrease in the chip giant’s market capitalization. Energy stocks also struggled amid falling oil prices. Conversely, defensive sectors such as utilities, consumer staples, and real estate performed relatively better.
Worst Weekly Drop in U.S. Equities in 18 Months
In Europe, the STOXX Europe 600 Index fell by 3.52% due to renewed concerns about global economic growth. Japanese stock markets also declined, with the Nikkei 225 Index down 5.8% over the week.
Other Stock Markets
U.S. economic data generally came in weaker than expected, raising concerns that the Federal Reserve may have delayed easing monetary policy. The ISM U.S. manufacturing activity index remained in contraction territory for August, with new orders decreasing for the third consecutive month.
U.S. Economic Data Weakened
The Labor Department’s payrolls report for August revealed a mixed picture of the labor market. Employers added 142,000 jobs, falling short of the 160,000 estimate, while July’s gain was revised down to 89,000, the lowest level since December 2020. The three-year average of non-farm payrolls is now slightly above 200,000. Historically, a drop below 100,000 has been a leading indicator for recessions, such as the dot-com bubble and the subprime crisis. Despite COVID-19-related distortions, this indicator remains noteworthy.
U.S. Monthly Non-Farm Payrolls Deteriorated
This week has seen continued volatility in stocks, but the big news for investors is that, for the first time in years, bonds are once again serving as a hedge against stock market declines. In other words, after a period of positive correlation that disrupted 60/40 portfolios, the stock-bond correlation is turning negative again. This is a significant development.
Is a major market shift underway?

The yield on the 10-year U.S. Treasury note declined following the jobs report, reaching its lowest level since May 2023. Bitcoin fell back below $55,000, and oil prices dropped to summer 2022 levels of $70.
There’s cheap, and then there’s very cheap. Chinese stocks are currently valued at just 40% of their U.S. counterparts, a figure that sits two standard deviations below the historical average.
U.S. Treasuries, Bitcoin, and Oil
This week has seen continued volatility in stocks, but the big news for investors is that, for the first time in years, bonds are once again serving as a hedge against stock market declines. In other words, after a period of positive correlation that disrupted 60/40 portfolios, the stock-bond correlation is turning negative again. This is a significant development.
Is a major market shift underway?
JOLTS data shows total nonfarm job openings (in red) compared to the S&P 500. In the past 25 years, an increasing stock market has always been accompanied by job growth. However, there has been a significant divergence since 2023.
Source: Bloomberg, Amy Nixon
Job MARKET vs. S&P 500

This is hard to ignore. The June and July U.S. jobs reports were revised down by another 86,000 jobs. This marks the second downward revision for the June report, with 6 of the last 7 jobs reports now revised lower, according to ZeroHedge. In fact, 11 of the last 15 jobs reports have been revised downward, amounting to millions of jobs being adjusted over the past few years

U.S. manufacturing has now contracted for the fifth straight month, with the ISM Manufacturing PMI falling to 47.2 points, below expectations of 47.5. New orders dropped to 44.6 from 47.4 in July, marking the third consecutive month of decline. Manufacturing activity has contracted in 21 of the last 22 months, extending the second-longest downturn in history. The concerning part? The prices paid index rose to 54.0 from 52.9 in July, expanding for the eighth consecutive month. Rising prices alongside shrinking output is rarely a favorable combination for stocks.
U.S. Manufacturing Contraction


Before COVID, the U.S. was paying $1 billion per day in interest on its debt. During the pandemic, that figure rose to $2 billion. Today, it has reached $3 billion per day. On the first day of September, U.S. debt increased by $64 billion, hitting a record high of $35.3 trillion.
Rising U.S. Debt

Two concerning trends in Europe: It's intriguing to note how the year of the Euro's introduction aligns with the trend in Italian industrial production. Meanwhile, German deindustrialization has reduced its industrial production to levels not seen since 2006.
concerning TRENDS IN EUROPE
Last week, crypto funds experienced outflows of approximately $600 million, marking the second-largest on record, surpassed only by levels seen in 2022 during a significant bear market. In contrast to Q1, when weekly inflows reached as high as $3.3 billion, outflows have become more common over the past several weeks. Despite expectations that the Fed may cut rates this month, risk appetite in the crypto market seems to have diminished. Bitcoin has dropped around 15% in the last two weeks and is now trading roughly 25% below its all-time high. Are crypto markets entering a bear market?
Source: BofA, The Kobeissi Letter.
Crypto FUNDS Outflows

AI-Driven Job Cuts
Lastly, the number of job cuts attributed to AI has risen in 2024 compared to 2023.

Market Recap 09/01/24
To call August a volatile month would be an understatement. The markets were rattled by concerns over payroll data and a potential recession, triggering a sharp selloff in stocks and sending the VIX soaring above 60 at the beginning of the month. However, markets managed to recover, ending the month nearly unchanged. August also saw a broadening of market leadership, with growth sectors underperforming. Notably, 90% of S&P 500 stocks are now trading above their 20-day moving average, the highest level since November 2023.
August Recap
Last week, the main U.S. equity indices finished with mixed results as trading volumes were light ahead of the Labor Day holiday weekend. The Nasdaq Composite was the worst performer, weighed down by a nearly 10% drop in NVIDIA's stock at its low point on Thursday. In contrast, value stocks outperformed growth shares by the widest margin since late July.
Last Week's Market Performance
The U.S. core personal consumption expenditures (PCE) price index rose by 0.2% in July, in line with expectations. This outcome appeared to reassure investors, as it confirmed that inflation remained subdued and close to the Federal Reserve’s target.
The yield on U.S. 10-year Treasuries edged higher over the week, as hopes faded that the Federal Reserve would cut interest rates by a full 50 basis points at its mid-September meeting. However, the CME FedWatch tool indicated that futures markets still anticipated at least a 25-basis-point cut.
Inflation Eases
In Europe, the STOXX Europe 600 Index climbed 1.34%, reaching a record high. Eurozone headline inflation slowed to 2.2% in August from 2.6% in July—the lowest level in three years and just above the ECB’s 2% target. Meanwhile, Japan’s stock markets wrapped up a volatile month on a positive note, with the Nikkei 225 Index gaining 0.7% over the week.
Eurozone and Japan
The dollar took a significant hit over the month but managed a strong recovery this week after testing near year-to-date lows. Gold rallied to new record highs on the month after early tumble. Bitcoin has slipped back below $60,000. Meanwhile, the VIX index has returned to complacent levels, hovering around 15.
U.S. Dollar, Gold, Bitcoin, VIX
Market concentration has now reached levels not seen since the Dotcom bubble of 2000. The combined share of technology, telecom, and healthcare sectors in global stocks hit a record 45% in July 2024. After the Dotcom bubble burst 24 years ago, these three sectors saw their global share decline for years, while financials, energy, and materials gained prominence. Will history repeat itself this time?
Market Concentration

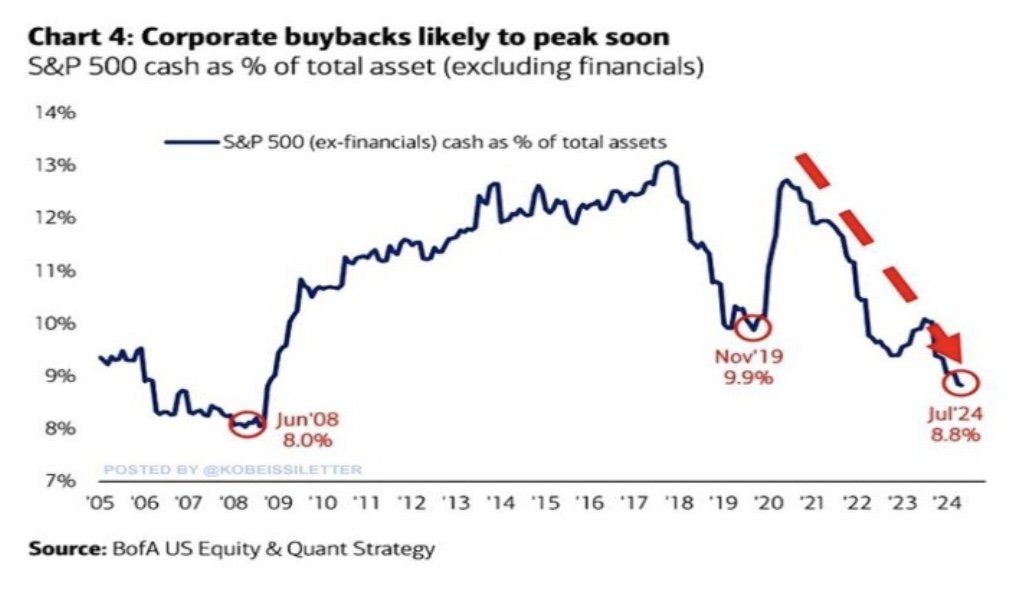
Cash as a percentage of total assets for S&P 500 companies fell to 8.8% in July, marking the lowest level since 2009. Over the past four years, this figure has dropped by 4 percentage points from near multi-decade highs. This percentage is now approaching the 2008 Financial Crisis low of 8%. Could this mean that record stock buybacks are nearing their end?
Dwindling Corporate Cash
July PCE inflation, the Federal Reserve's preferred inflation measure, came in at 2.5%, slightly below the expected 2.6%. Core PCE inflation was 2.6%, also below expectations of 2.7%. Both headline and core PCE inflation remained flat compared to June. The gap between the Fed Funds Rate and Core PCE inflation is now at its widest since September 2007, signaling the tightest monetary policy in 17 years.
Inflation and Monetary Policy

While U.S. stock markets are hitting new highs, there are signs of trouble for consumers. The savings rate is at a record low, and credit card debt has reached an all-time high. An example of this strain is Dollar General, whose shares plummeted 20% after the retailer cut its outlook, citing "financially constrained" customers, according to CNBC on August 29.
The State of the U.S. Consumer

The U.S. Budget and Government Spending
US government spending is estimated to hit $6.8 trillion in Fiscal Year 2024. Medciare, Medicaid, and Social Security expenditures are projected to reach a $3.1 trillion, or 46% of the budget. Defense and non-defense discretionary spending will likely exceed $1.8 trillion, accounting for 27% of all expenditures. Net interest and other spending are set to hit $892 billion and $908 billion, respectively, or 13% a share each. All while the government projects $4.7 trillion in revenue. This leaves a whopping $1.9 trillion budget gap which has to be borrowed, the highest in 3 years.

Are we in the midst of the biggest U.S. housing bubble of all time? Inflation-adjusted home prices today are nearly 100% higher than the 130-year average. This has only happened twice in U.S. history: in 2006 and now. From 1890 to 2000, home prices closely tracked inflation and never entered a national bubble.
U.S. Housing and Affordability


U.S. household allocation to stocks has reached 57% of total assets, near the highest level ever recorded. This percentage has more than doubled over the past 15 years and is now on par with the peak of the Dotcom bubble in 2000.
Allocation to U.S. Stocks

A striking chart from the IMF highlights the disparity between U.S. and Eurozone GDPs from 2008 to 2023. The U.S. economy is now nearly twice the size of the Eurozone's, a significant shift from 2008 when they were comparable.
U.S. Economy vs. Eurozone
Market Recap 08/25/24
The Dow Jones and S&P 500 Index edged closer to record highs this week, as investors responded positively to Fed Chair Powell's announcement at Jackson Hole, hinting at forthcoming interest rate cuts. Gains were widespread, with small-cap stocks outperforming large-caps, and the equal-weighted S&P 500 Index surpassing its market-cap-weighted counterpart. However, trading volume remained notably low for most of the week.
On Friday, stocks surged at the start of trading after the text of Powell's speech at Jackson Hole was released. In his remarks, Powell acknowledged that "the time has come for policy to adjust... we will do everything to support the labor market," suggesting that policymakers might cut rates in September. Additionally, Powell appeared to leave the door open for a 50 basis point cut, rather than the expected 25 basis points. The release of minutes from the Fed’s previous policy meeting earlier in the week also seemed to boost investor sentiment.
As a result of the Fed's shift, the total Put/Call Ratio dropped to 0.65, the lowest level since July 2021
Market Rallies on Fed Chair Powell's Dovish Signals

On the macroeconomic front, a significant surprise emerged from the Labor Department’s annual revision of its nonfarm payroll data (through March), revealing 818,000 fewer jobs added over the past 12 months than initially reported. This amounts to an average shortfall of about 68,000 jobs per month, the largest since 2009. At the sector level, the most substantial downward revision occurred in professional and business services, where job growth was 358,000 lower than originally estimated.
The economic growth outlook for the second half of 2024 has been downgraded. The Fed now believes that consumer spending is starting to weaken, as evidenced by rising delinquencies.
Consequently, on Friday, U.S. Treasury yields fell, with the short-end leading the decline (2Y -10bps, 30Y -2bps). The 2-Year yield dropped back below 4%, and the yield curve (2s30s) steepened notably.
Job Data Revisions Trigger Economic Concerns & Lower Treasury Yields

The US dollar and oil dropped to their lowest levels of 2024, while Bitcoin surged on Powell's statements, setting the stage for a major short-squeeze and testing the $64k mark.
Dollar and Oil Decline as Bitcoin Surges on Rate Cut Expectations
At current levels, the S&P 500 is above every year-end 2024 price target set by Wall Street strategists and stands 14% above the average target of 4,861, with 135 days still left in the year. However, there's a warning sign: while S&P 500 EPS estimates for Q3 are declining, stock prices are rising.
Although there’s talk of “cash on the sidelines” with regard to total money market fund assets, their firepower relative to the size of the equity market isn’t what it used to be. In fact, cash as a percentage of S&P 500 market cap has been trending lower over the past year.
S&P 500 Performance and Market Concerns

The record stock price levels strongly suggest a soft landing scenario. However, a closer analysis of the economy reveals other indicators pointing toward a hard landing:
The U.S. revised job additions downward by 818,000, marking the largest adjustment since 2009. The economy lost 192,000 jobs in Q3 2023 but gained 344,000 in Q4 2023.
The unemployment rate rose to 4.3%, the highest since 2021.
Five of the last six job reports have been revised downward.
A record number of Americans are working multiple jobs.
The U.S. dollar has lost 25% of its purchasing power in four years.
Credit card delinquencies have reached 11%, the highest in over a decade.
Deficit spending as a percentage of GDP is at WWII levels, indicating crisis-level government spending.
Existing home sales fell 2% year-over-year in July to 4.1 million, the weakest since 2012. Housing starts dropped 6.8% month-over-month to 1.24 million, the lowest since the 2020 pandemic.
New bankruptcy filings reached 6,276 in Q2 2024, the highest since Q2 2017, with company bankruptcies doubling in two years.
The Conference Board Leading Economic Index fell 0.6% month-over-month, its longest decline since the 2008 financial crisis.
Lastly, according to the Financial Times, the rate at which U.S. start-ups are failing is now more than seven times higher than in 2019, threatening millions of jobs and posing a risk of spillover to the broader economy
The Question of a "Soft Landing"

Thank you for reading. Please feel free to leave any comments in our sign-up section.
The Beryl Consulting Group Editorial Team
Market Recap 08/18/24
U.S. equities experienced their strongest week since 2023, led by the Nasdaq, which gained over 5% and rose 12% from last Monday's lows. Investors responded positively to favorable news on inflation and economic growth, raising hopes for a "soft landing" for the economy. Notably, AI chip giant NVIDIA surged 19% over the week. Growth stocks significantly outperformed value stocks, while Small Caps benefited from an ongoing short squeeze.
U.S. Equities Surge
Official economic data showed that consumers remain resilient despite a cooling labor market. On Thursday, the Commerce Department reported a 1.0% increase in July retail sales, the strongest in 18 months, indicating that U.S. consumers are still spending and remain relatively optimistic about the future.
Resilient U.S. Consumer
The Consumer Price Index (CPI) inflation, reported Wednesday, met expectations and reassured investors as the year-over-year CPI increase fell below 3% for the first time in three years.
Inflation Eases
The U.S. 10-year Treasury yield mostly declined throughout the week due to mild inflation data but spiked on Thursday following strong retail sales numbers.
Volatile U.S. Treasuries
Credit markets rallied, shifting from "hard landing" to "soft landing" expectations. The dollar fell to a five-month low, while gold hit a record high, surpassing $2,500 for the first time. In Europe, the STOXX Europe 600 Index gained 2.5%, and Japan's Nikkei 225 Index surged 8.7% as the yen weakened to the upper-JPY 148 range against the dollar. Oil prices remained flat after a volatile week, and cryptocurrencies saw fluctuations, with Bitcoin rebounding to $60,000 by Friday, ending the week unchanged.
Other Asset Classes
U.S. banks are currently dealing with $517 billion in unrealized losses, making them especially eager for interest rate cuts.
U.S. Banks' Losses

Source: BoA, Barchart
Since the S&P 500 peaked on July 16th, higher dividend-paying stocks have outperformed those that don't pay dividends. There are exactly 100 non-dividend-paying stocks in the S&P 500, and these stocks have dropped an average of 5.6% from July 16th through last Friday's close. In contrast, the 100 stocks in the index with the highest dividend yields have seen slight gains during the same period.
Dividend-Paying Stocks Outperform

Source: Bespoke
Foreign investors withdrew a record amount of money from China last quarter. China's direct investment liabilities in its balance of payments fell by nearly $15 billion during the April-June period, marking only the second time this figure has turned negative, according to data released Friday by China’s SAFE. For the first half of the year, this figure was down by about $5 billion.
Record Withdrawals from China

Source: Bloomberg
The delinquency rate for commercial mortgage-backed securities (CMBS) tied to office properties spiked to 8.1% in July, the highest level in 11 years. The rate has quadrupled in just 1.5 years, with delinquencies currently rising faster than they did during the 2008 financial crisis. In May, a top AAA-rated CMBS incurred a $40 million loss, the first such loss since the 2008 crisis.
Rising Office CMBS Delinquencies

Source: The Kobeissi Letter

The interest expense on U.S. public debt reached a record $1.11 trillion over the past 12 months, more than doubling in the last two years. At the current rate, it will soon surpass Social Security as the largest item in the federal budget.
Surging U.S. Public Debt Interest
Source: Charlie Biello
Before adopting the Euro, countries like Greece, Italy, and Spain would adjust for lower productivity through annual currency devaluation. Within the European currency union, the only remaining option is to adjust through real wages, which has led many people into poverty.
Eurozone Economic Adjustments

Source: FT, Michele Arouet
During last week’s earnings call, Walmart's CEO highlighted the use of AI, stating, "We’ve used multiple LLMs to accurately create or improve over 850,000,000 pieces of data in our catalog. Without generative AI, this work would have required nearly 100 times the current headcount to complete in the same amount of time."
AI at Walmart
The FTC has banned fake online reviews and inflated social media influence, with the new rule set to take effect in October. The Federal Trade Commission unanimously voted to prohibit marketers from using fake reviews, including those generated by AI, and other deceptive advertising practices. The ban also prevents marketers from exaggerating their influence, such as by paying for bots to artificially inflate their follower counts. With the growth of e-commerce, influencer marketing, and generative AI, more advertisers have turned to automated tools like ChatGPT to quickly generate user reviews for online products.
FTC Bans Fake Online Reviews
Thank you for reading. Please feel free to leave any comments in our sign-up section.
The Beryl Consulting Group Editorial Team
Market Recap 08/11/24
The major U.S. equity indexes mostly closed lower for the week after rebounding from the largest sell-off in nearly two years. On Monday morning, the S&P 500 approached correction territory, falling over 10% from its peak, while the Nasdaq was down 15.8% from its high.
A recent modest increase in Japanese short-term interest rates triggered a partial unwind of the carry trade. A sharp rise in the yen over the preceding weeks made the trade unprofitable, leading many investors to exit their positions. Additionally, several major companies reported signs of weakening consumer demand during earnings calls.
The CBOE Volatility Index (VIX), often referred to as the "fear gauge," experienced dramatic swings, briefly spiking to 65.7 on Monday—its highest level since late March 2020—before retreating to end the week at 20.6. A record-breaking 3.3 million S&P 500 put options were traded on Monday, contributing to a new daily option volume record of 73 million contracts.
Later in the week, the S&P's services activity gauge indicated that the U.S. economy remains solidly in expansion territory at 55.5. A reassuring drop in weekly jobless claims on Thursday contributed to a bounce-back rally, with the S&P 500 achieving its best daily gain since November 2022.
However, most commodities have plummeted in price over the past month, indicating underlying weakness in the global economy, even as the U.S. stock market rebounds from recession concerns.
Global Market Recap
The market is currently pricing in a 50-basis point rate cut next month. Historically, market returns following rate cuts have been positive, except during periods of broader crisis. Equities tend to perform well after the start of a Fed cutting cycle unless growth remains weak.
ANTICIPATED RATE CUTS

Japan's stock markets began the week with the most severe one-day sell-off in decades (-12%). However, by the end of the week, they had recouped much of the lost ground, with the Nikkei 225 Index down just 2.5%. Last Monday’s market volatility has been so extreme that similar swings have only occurred during the global financial crisis (green) and the early 2000s (red).
Japan's Market Volatility

The dollar ended the week lower, and gold also closed marginally lower. In fixed income, the U.S. 10-year Treasury yield increased over the week. Oil prices had a notable week, with WTI crude recovering from six-month lows around $72 to finish the week at $77, returning to pre-payroll levels. Cryptocurrencies saw a rebound, with Bitcoin experiencing significant volatility, ultimately ending the week approximately unchanged.
Dollar, Gold, OIL and Cryptocurrency Performance

Unwinding the Yen Carry Trade
This chart—showing the Japanese Yen versus the USD—is arguably the most important in the world today. Here’s why:
1. For the past 30 years, Japan has maintained a 0% interest rate on its currency.
2. Consequently, for three decades, investors have been able to borrow yen at virtually no cost and invest the funds globally. These investments have included T-Bills abroad and a basket of risk assets like the Nasdaq.
3. For the first time in many years, the Bank of Japan (BOJ) has raised rates, signaling to the market that the era of free money may be coming to an end. This has prompted investors to unwind their carry trades, sending funds back to Japan.
4. The scale of this unwinding is massive, with estimates of the trade’s value exceeding $4 trillion.
As Deutsche Bank notes, “The BOJ has no choice and is merely delaying the inevitable. With a gross balance sheet value of around 500% of GDP, or $20 trillion, the Japanese government’s balance sheet is, simply put, one giant carry trade.

Stock market corrections are a regular part of market behavior. Since 1928, the S&P 500 has experienced a decline of 5% or more in 94% of years. A correction of 10% or more occurred in 61 of the last 96 years. Larger drawdowns of 15% or more were observed in 40% of those years. Finally, a bear market, defined as a 20% or greater drop, occurred in 25 of the past 96 years. These pullbacks are a normal aspect of market cycles.
Market Corrections


The Sahm Rule is a reliable signal that a recession has officially begun. Since 1953, the Sahm Rule has never failed in predicting a recession.
Sahm Rule – Recession Indicator
The primary reason the economy has avoided a recession over the past two years is the substantial spending from the Inflation Reduction Act and CHIPs Act. However, as the pace of this spending slows, it may put downward pressure on economic growth in the future.
Government Spending

Currently, 11% of credit card balances in the U.S. are over 90 days delinquent, the highest level since 2012. U.S. bankruptcies have surged to their highest point in more than 12 years. At the same time, U.S. household savings have hit an all-time low, while outstanding credit card debt has reached its highest level since 2010.
Household Debt, Savings & Business Bankruptcies


And finally, a bit of muse - athletes earn from their country for winning an Olympic medal
Olympics Medals
Thank you for reading. Please feel free to leave any comments in our sign-up section.
The Beryl Consulting Group Editorial Team
Market Recap 08/05/24
With stocks selling off and bond yields dropping, recession fears have resurfaced, causing investors to worry about a potential U.S. economic downturn.
Major U.S. equity benchmarks closed lower last week as investors reacted to the busiest week of the quarterly earnings reporting season and disappointing monthly economic data. The sell-off continued into Monday.
RECESSION FEARS
Economic concerns began last Thursday with disappointing manufacturing and layoff data, exacerbated on Friday by the Labor Department's report of lower-than-expected job creation and a rising unemployment rate in July.
Is the U.S. labor market in freefall?
Private sector job openings are at a six-year low.
Hires have plunged the most in over a year, reaching their lowest point since April 2020.
Quits have tumbled to their lowest level since the COVID-19 crash.
Labor Market Concerns
The Federal Reserve was also on investors' minds, with growing sentiment that the Fed is waiting too long to ease short-term benchmark borrowing rates, which currently sit at 23-year highs. Like equities worldwide, U.S. longer-term rates also plummeted in the aftermath of both the ISM manufacturing print and the jobs data, sending the yield on the benchmark 10-year Treasury note to its lowest intraday level (3.77%) since late December. Poor U.S. economic surprises have pushed Treasury yields lower, with 2-year yields crashing nearly 30 basis points on Friday alone, down a stunning 50 basis points for the week, and falling another 10 basis points on Monday.
Federal Reserve and Treasury Yields
The Nasdaq Composite pulled back last week, down over 10% from its July high, entering a technical correction. This marks its fourth consecutive week of decline, the longest since December 2022, and it broke below its 100-day moving average on Friday – see chart below, and as of Monday is only 150 points away from its 200-day moving average
Equity Market Performance

The S&P 500 found support at its 100-day moving average last week – see chart below. However, on Monday, that support was breached by 145 points.

The recent rotation toward value stocks and small-caps stalled as the small-cap Russell 2000 Index sharply declined at the end of the week, recording its worst week since March 2023. As of Monday, the index is nearly flat year-to-date, giving up all gains for the year.
In addition to economic and monetary policy concerns, the market faced the unwinding of a popular trade involving borrowing in low-interest currencies like the Japanese yen and Swiss franc and buying higher-yielding currencies — the "carry trade" that has provided global markets with liquidity. As a result, some investors quickly unloaded profitable carry trades to cover losses elsewhere. An unexpected rate hike from the Bank of Japan last week, along with currency intervention, sparked fears that the carry trade is over.
The yen rallied sharply on Monday, and Japanese stocks had their worst day since Black Monday in October 1987. The BOJ's decision to hike rates and turn hawkish after nearly 18 years stunned investors, wiping out all Japanese stock gains for 2024 in just four days. As of Monday, the Nikkei is down a stunning 6% after being up 20% year-to-date only a week ago.
CARRY TRADE Impact
Adding to financial woes, U.S. commercial property foreclosures jumped to over $20 billion during the second quarter, the highest in a decade. Delinquency rates on office building loans hit 8.11%, the highest in more than a decade.
Commercial Property
U.S. NATIONAL DEBT

U.S. national debt recently surpassed $35 trillion for the first time in history, as discussed in our July 22 Spotlight article.
Since 2020, the U.S. has added approximately $12 trillion in federal debt, equating to about $105,000 in federal debt per person.
Deficit spending as a percentage of GDP is currently at World War II levels. The U.S. is leading all the developed nations. See charts below.


De-grossing (the active reduction in gross exposure relative to total gross exposure in U.S. equities) that started last Tuesday marks the third-largest de-grossing event since 2016 (excluding COVID-19 and January 2021). The question remains: how far will the world's central banks allow stocks to fall before they unleash the liquidity firehose?
Market De-grossing

A key measure of expected stock market volatility, the CBOE Volatility Index (VIX), surged to its highest level in over four years on Monday morning as global equities fell sharply. The VIX briefly rose above 65, up from around 23 on Friday and roughly 17 a week ago, before cooling to the 30-40 range. This is the highest the VIX has reached since March 2020, following the Federal Reserve's emergency actions during the COVID-19 pandemic.
Explosion of the VIX
The last time BTC traded below $53,000 was on February 26 this year, following a price rally driven by the approval of spot Bitcoin exchange-traded funds (ETFs) in the United States. Ether's price also fell sharply, dropping 18% from $2,695 to a low of $2,118 during the same period before recovering to the $2,300-2,400 range. The sharp decline wiped out over $740 million in leveraged positions across the crypto market in the past 24 hours, with more than $644 million in leveraged longs being liquidated, according to CoinGlass data.
Sell-off in Crypto
Thank you for reading. Please feel free to leave any comments in our sign-up section.
The Beryl Consulting Group Editorial Team
U.S. stocks posted mixed returns for the second consecutive week, with small-caps and value stocks continuing to outperform large-cap growth shares that have led the market for much of the year. Last week was notable for the S&P 500's over 2% sell-off on Wednesday, the first time since February 2023, while the Nasdaq suffered its worst loss since October 2022. This third quarter has been harsh on the Magnificent 7 stocks, experiencing their worst drawdown yet in the 2023-24 bull market. On the macroeconomic side, the housing market slump continued, but business investment picked up. The U.S. economy accelerated in Q2, showing annualized growth of 2.8%. Q1 showed 1.4%, and Q2 was expected at 2% (annualized). Yet growth-sensitive sectors like transportation have not done so well.
Mixed Returns for U.S. Stocks and Economic Indicators
Market Recap 7/29/24

Investors appeared reassured by the Fed’s preferred inflation gauge (PCE), which solidified expectations for a Fed rate cut at its September meeting. The yield on U.S. 10-year Treasuries ended the week slightly lower while credit spreads remained tight. Gold ended the week slightly lower, while Bitcoin surged back to $68k.
So far in 2024, only one-third of the stocks in the S&P 500 are outperforming the benchmark. This marks the biggest three-week underperformance of the Nasdaq compared to Small Caps since the peak of the dotcom bubble. The S&P 500 is trading below its 50-day moving average. Is a drop to the 100-day coming? Over the last 100 years, the median year has seen an S&P 500 peak-to-trough drawdown of 13%. The current drawdown has only been 5%.
Is there more drawdown ahead for the S&P 500 in 2024?

Over the last 100 years, the median year has seen an S&P 500 peak-to-trough drawdown of 13%. The current drawdown has only been 5%.

India is quickly catching up to China as the world’s largest emerging market. Indian stocks now comprise nearly 20% of the MSCI Emerging Markets Index, while China's share has dropped to a quarter from 40% in 2020. This narrowing gap has become one of the biggest issues for investors in emerging markets this year as they debate whether to invest in an already red-hot Indian market or in relatively cheap Chinese stocks that are being hit by an economic slowdown.
China's 10-Year yield has fallen to a record low. What is the Chinese bond market signaling about China's economy? For more details, please refer to our most recent Spotlight article.
Emerging Markets: India vs. China
The U.S. Treasury yield curve is on the verge of turning positive for the first time since 2022. The difference between 10-year and 2-year Treasuries has been negative since July 6, 2022. This means the yield curve has been inverted for a record 747 days. Historically, when the yield curve steepened this quickly and turned positive, a recession followed within months. In comparison, the second longest streak of inversion lasted 624 days starting in August 1978 and was followed by a double-dip recession. This is another indicator that a recession might be approaching.
U.S. Treasury Yield Curve
The U.S. National Debt has increased by $3.5 billion in the 13 months since the debt ceiling was suspended. The psychologically important $35 trillion milestone will be crossed soon, representing more than 120% of GDP. Earlier this year, the cost of interest payments alone surpassed defense spending. This milestone will be crossed by the time Democrats meet in Chicago in a few weeks if the debt continues to grow by $8 billion per day.
growing U.S. National Debt

The Bloomberg Industrial Metals Spot Subindex has dropped about 1% this year as of July 29, erasing a 24% gain achieved by May, indicating potential downward momentum for the remainder of the year. The rise of gold relative to base metals is an unfavorable indicator for global economic growth, compounded by plummeting bond yields in the world's second-largest economy and leading commodity demand center.
Since its inception in 1999, the Euro has lost 40% of its purchasing power. To put this into perspective, 1 Euro today can only purchase 60% of what it could in 1999.
Adjusted for inflation, the Japanese Yen is at its weakest point in 57 years.
EURO & YEN IN DECLINE
Global Recessionary Signals?
Thank you for reading. Please feel free to leave any comments in our sign-up section.
The Beryl Consulting Group Editorial Team
Market Recap 7/22/24
Last week, the stock market experienced a notable shift from this year’s megacap winners to smaller names. The S&P 500 and Nasdaq dropped 1.97% and 3.65%, respectively, marking their largest weekly losses since April. The Nasdaq also ended a six-week winning streak. In contrast, the Dow rose 0.72%, and the Russell 2000 gained 1.68%. This shift away from megacap AI beneficiaries led to the Nasdaq’s underperformance, with the tech sector dragging the S&P 500 down by 5.1%. The 2-Year Treasury rose 6 basis points to 4.52%, and the 10-year increased 6 basis points to 4.24%. Bitcoin surged 15%, and the VIX jumped 33% to 16.5, crossing 17 at one point—its largest absolute weekly jump since March 2023—while bond volatility remains muted.
Shifting Trends in Stock Performance
Tech stocks are currently at high levels due to the stagnation in the IPO market, with almost no new companies going public. Despite this, many vested interests maintain that the market is not broken. Public stocks are seen as overvalued, and private companies struggle to secure funding.
Tech Sector and IPO Market
On Friday, a major IT outage, dubbed the “largest IT outage in history,” was caused by a CrowdStrike update that conflicted with Microsoft, disrupting businesses worldwide, including financial services, doctors’ offices, and TV broadcasters. Air travel was particularly affected, with planes grounded and services delayed. CrowdStrike CEO George Kurtz stated that the issue, not a security incident or cyberattack, has been identified, isolated, and fixed, although full recovery may take weeks. CrowdStrike stock fell 11%. Ironically, the company known for preventing malware experienced an update that caused widespread disruption.
CrowdStrike IT Outage
The NYSE A-D line continues to make new highs, indicating that the US equity bull market is not limited to the seven "magnificent" NASDAQ stocks, which have been the most crowded trade among investors. This bull market has persisted for over two years, despite occasional corrections and rotations.
Equity Bull Market and NYSE A-D Line

Currently, the tech sector represents 44% of the S&P 500 index when including Amazon, Meta, and Alphabet. This significant representation has led to historical distortions that investors struggle to justify. The Magnificent 7 stocks have lost $1.3 trillion in market cap since their peak on July 10, marking the biggest seven-day drop ever for this group.
Tech Sector Over representation
Last week's market rotation featured a sharp rally in small-cap stocks, buoyed by increased expectations of an upcoming interest rate cut, as a large portion of Russell 2000 debt is floating. US small caps are up 6.8% over the last three trading days, while US large caps have remained flat. The relative underperformance of the Nasdaq compared to small caps over the last two weeks is the largest since the reversal at the top of the Dotcom bubble in 2001.
Small-Cap Stocks Rally

US National Debt: A Financial Overview
The current US national debt level is almost $35 trillion, with a projected minimum $2 trillion deficit going forward. Government revenues are around $5 trillion per year. Social Security, Medicare, Medicaid, and interest on the debt consume 100% of this revenue. Interest on the debt alone exceeds $1 trillion per year, more than 20% of government revenue. An all-time high of $9.3 trillion in US debt is set to mature within the next 12 months.
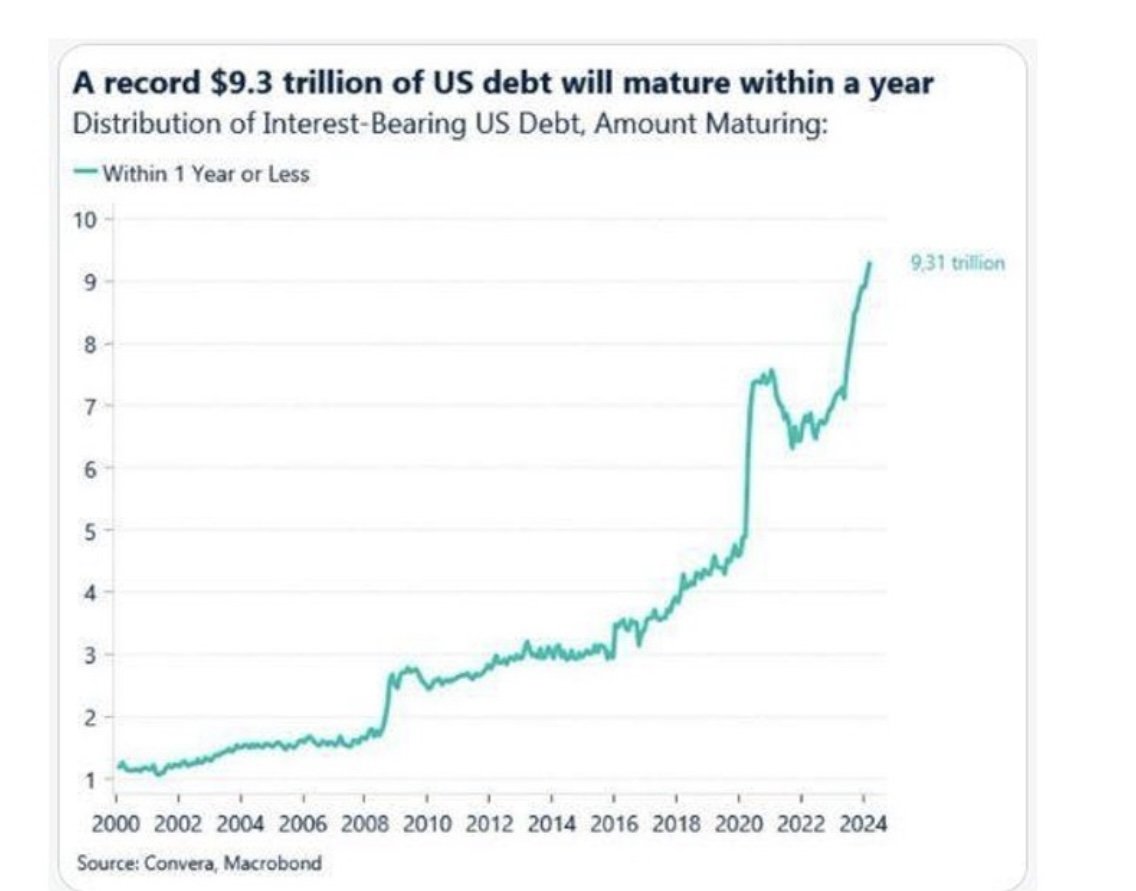
The market cap of the Magnificent 7 stocks is now higher than any non-US stock market globally. The group's value is approximately $15.7 trillion, nearly double China’s stock market value of $8.7 trillion. It is also worth almost as much as the German, Canadian, UK, French, and Indian stock markets combined. Apple, Nvidia, and Microsoft each have market caps greater than the entire German and Canadian markets. To put this into perspective, the total US stock market is worth $50 trillion, just three times more than the Magnificent 7.
The Magnificent 7’s Market Cap
Thank you for reading. Please feel free to leave any comments in our sign-up section.
The Beryl Consulting Group Editorial Team