
The 10-Year Treasury Yield: Inflation, Real Rates, Geopolitics, Commodities & AI
June 30, 2026
Back to Basics
Treasury bonds are debt securities issued by the United States government. The government borrows money for a set period from the lender in exchange for regular interest payments and the return of the principal payment at maturity. The bonds’ coupon rate is the fixed interest paid annually, while the yield is the annual expected return on investment for the bond, factoring in market price and time to maturity. US Treasury bonds are considered one of the safest forms of investment thanks to the backing of the US government.
These Treasury securities are split between several different maturity periods, varying from less than a year to 30 years. The yields for these securities act as a barometer for investor confidence and general economic health. Higher yields are typically linked with expectations of higher growth and inflation as investors wish to protect their investments. Lower yields typically reflect an economic downturn and a turning away from riskier investments, such as the equity market. Bond prices move with yields in the opposite direction. As yields rise, prices fall, and vice versa.
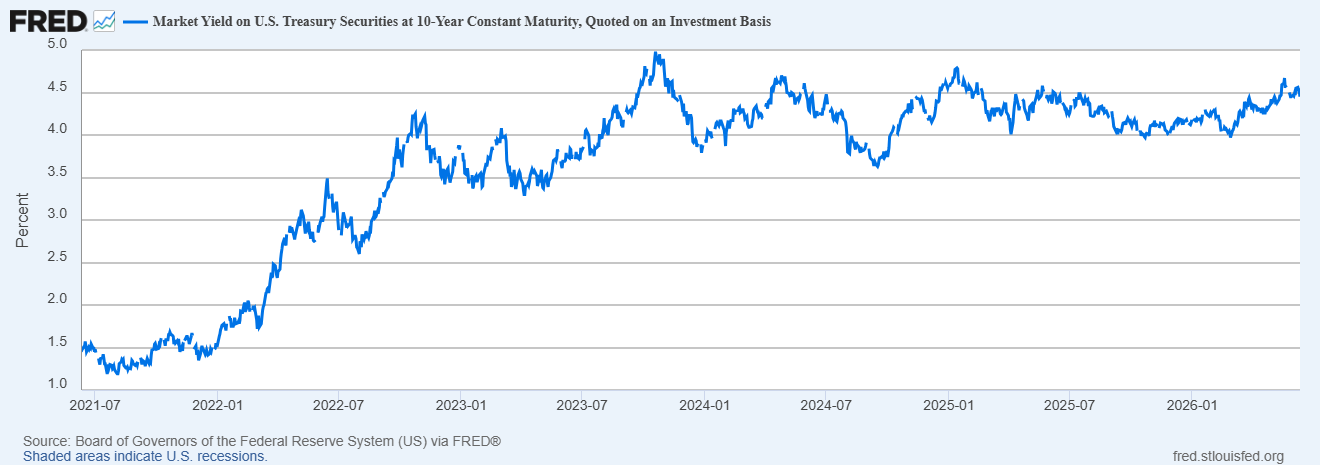
The key figure is the 10-year Treasury bond yield, which acts as a benchmark for many types of interest rates, most notably 30-year mortgages and corporate loans. When 10-year yields rise, it becomes more expensive to borrow money. When they fall, borrowing becomes cheaper, stimulating the economy. As of June 29, 2026, the 10-year yield sits at 4.38%.
US 10-Year Treasury Bond Yield 2021-2026
What Affects the 10-Year Yield?
The two most important factors when determining the ten-year yield are expected inflation and real yield. The 10-year yield represents the nominal yield, meaning it doesn’t account for inflation, unlike the real yield. This relationship is best represented by the Fisher Equation, which is: Nominal Yield Real Yield + Expected Inflation.
Inflation
Inflation is the core contributing factor to a change in 10-year yields. If investors expect higher inflation, they will demand higher yields to protect their return on investment. Historically, the Fed has aimed for a benchmark core inflation of 2%, yet as of June 2026, it sat at ~2.9%. The Consumer Price Index (CPI) reported an annual inflation rate of 4.2% the same month, the first time CPI has passed 4% in three years. CPI was as low as 2.4% in January 2026, with signs of further cooling. However, following the breakout of the US-Iran war, CPI shot up to 3.5% and has continued to rise due to volatility in energy and food prices.
Following the announcement of the US-Iran memorandum of understanding on June 14, 2026, Brent crude oil has dropped to ~$70 per barrel, reaching pre-war prices. The memorandum bought 60 days for continued negotiations between the US and Iran, meaning that the conflict could very well continue into the future if negotiations break down or Israel continues attacking Lebanon, which it has. Israeli Defense Minister Katz claims that Israel will not pull out of seized Lebanese territory. Even if the strait reopened immediately, inflation will continue to affect markets as supply chains could require months to return to normal. Despite recent conflict surrounding the Strait, oil prices remain relatively unaffected. However, a total breakdown in negotiations could lead to Brent oil climbing back to its wartime highs.
The Fed
Typically, when the Fed cuts Federal Fund Rates, they do so during periods of economic downturn in order to encourage borrowing and investment to revitalize the economy. This leads to 10-year Treasury yields decreasing as investors are willing to pursue riskier, and potentially more profitable, investments. When the Fed raises rates, it makes borrowing more expensive, causing equity markets to fall. At the same time, this typically forces 10-year Treasury yields to rise as the bond market adjusts to the higher interest rate environment. Yet, the Fed has continuously cut rates by a total of 175 basis points since September 2024, and yields have continued to rise thanks to sticky inflation, persistent growth, and geopolitical shocks stoking future inflation.
Following the Fed meeting on June 17, 2026, the Fed has maintained target rates at the 3.5%-3.75% range. Swap Traders are pricing in a 70% chance that the Fed will hike rates by a quarter point by December 2026. Fabio Bassi, head of cross-asset strategy at JPMorgan, expects yields to rise to 4.7% by the end of the year following the hike. Additionally, the new chair of the Fed, Kevin Warsh, wishes to reduce the central bank’s balance sheet substantially, leading to the potential sell-off of trillions in US Treasury bonds, which would unavoidably push yields upwards.
Real Yield
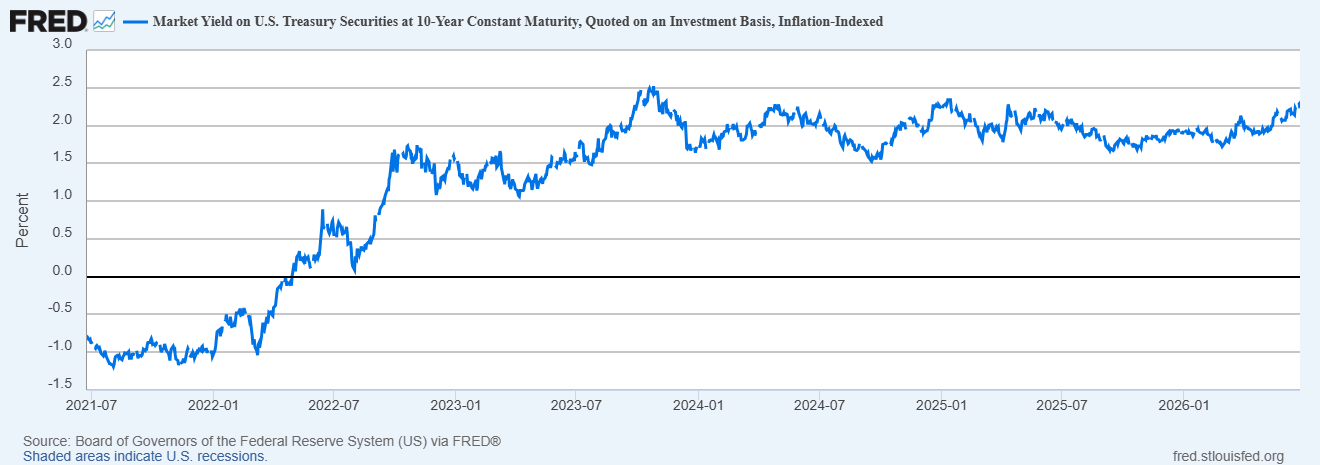
The 10-year Treasury bond real yield is measured by Treasury inflation-protected securities (TIPS). Real yield rates reached an all-time low in August 2021 at approximately -1.18%. As of June 11, 2026, the TIPS yield is 2.16%. Since August 2021, real yield has been consistently growing, contributing to the increase in nominal yield as seen by the Fisher equation. Growth in real yield has been driven primarily by rising term premiums due to geopolitical shocks, higher real growth expectations stemming from AI investment, and an increasing government deficit.
After the announcement of the US-Iran peace deal and subsequent uncertainty surrounding the opening of the Strait of Hormuz, TIPS briefly fell to 2.12% before rising as high as 2.27% on June 23, 2026. As of June 28, 2026, TIPS has returned to 2.166% despite uncertainty regarding the safety of the Strait of Hormuz.
US 10-Year TIPS Yield 2021-2026
Term Premium
Term Premiums are the additional compensation investors demand for holding long-term bonds instead of rolling over short-term debt. The term premium for 10-year zero-coupon Treasury bonds reached 0.8285% in May 2026, the highest it has been since 2011. As of June 18, 2026, the term premium is at 0.7519%.
US 10-Year Term Premiums 2021-2026
Figure 3. 10-Year U.S. Treasury Term Premium, 2021–2026. Source: FRED
Term premiums have been on the rise due to investor uncertainty stemming from a multitude of factors such as sticky inflation, rising government deficit, trade policy (tariff shocks), and geopolitical tension. Investor confidence remains uncertain, and as long as the conflict in Iran persists, term premiums are unlikely to fall.
If the recent US-Iran peace deal lasts long-term, term premiums will likely fall towards their pre-war levels, which as of February 27, 2026, were 0.4627%. Term premiums already fell in preparation for the US-Iran ceasefire and they will likely continue to fall as long as the Strait of Hormuz remains open and energy prices fall, which as of June 28, 2026, remains uncertain. However, the underlying pressure from the tariff shocks will likely keep yields at their 2025 elevated levels.
Growth
US Real GDP continued to rise in Q1 2026. Consumer spending has remained stable while corporate profits and equity markets continue to grow. Despite the ongoing conflict, the S&P 500 had reached record highs this quarter on nine separate occasions. Typically, the equity market suffers under higher 10-year Treasury yields as investors would rather put their money in the safer option. Yet, as yields continued to increase and the Iran conflict dragged on, equity markets continued to hit record highs. This is primarily due to the surge in AI optimism-related investments as well as confidence in an early resolution to the US-Iran War.
United States Stock Market Index, June 2025 - June 2026
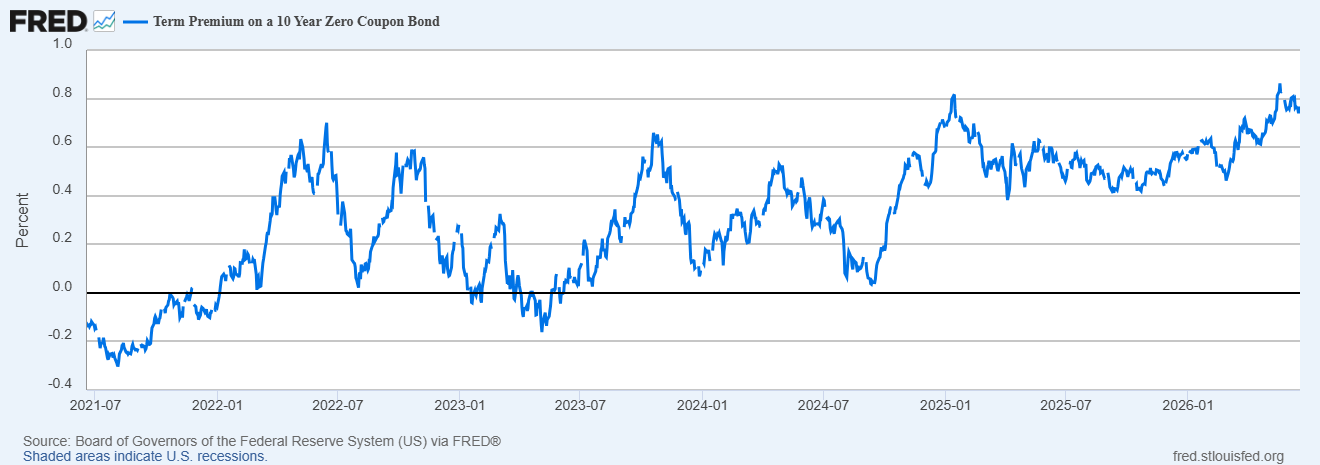
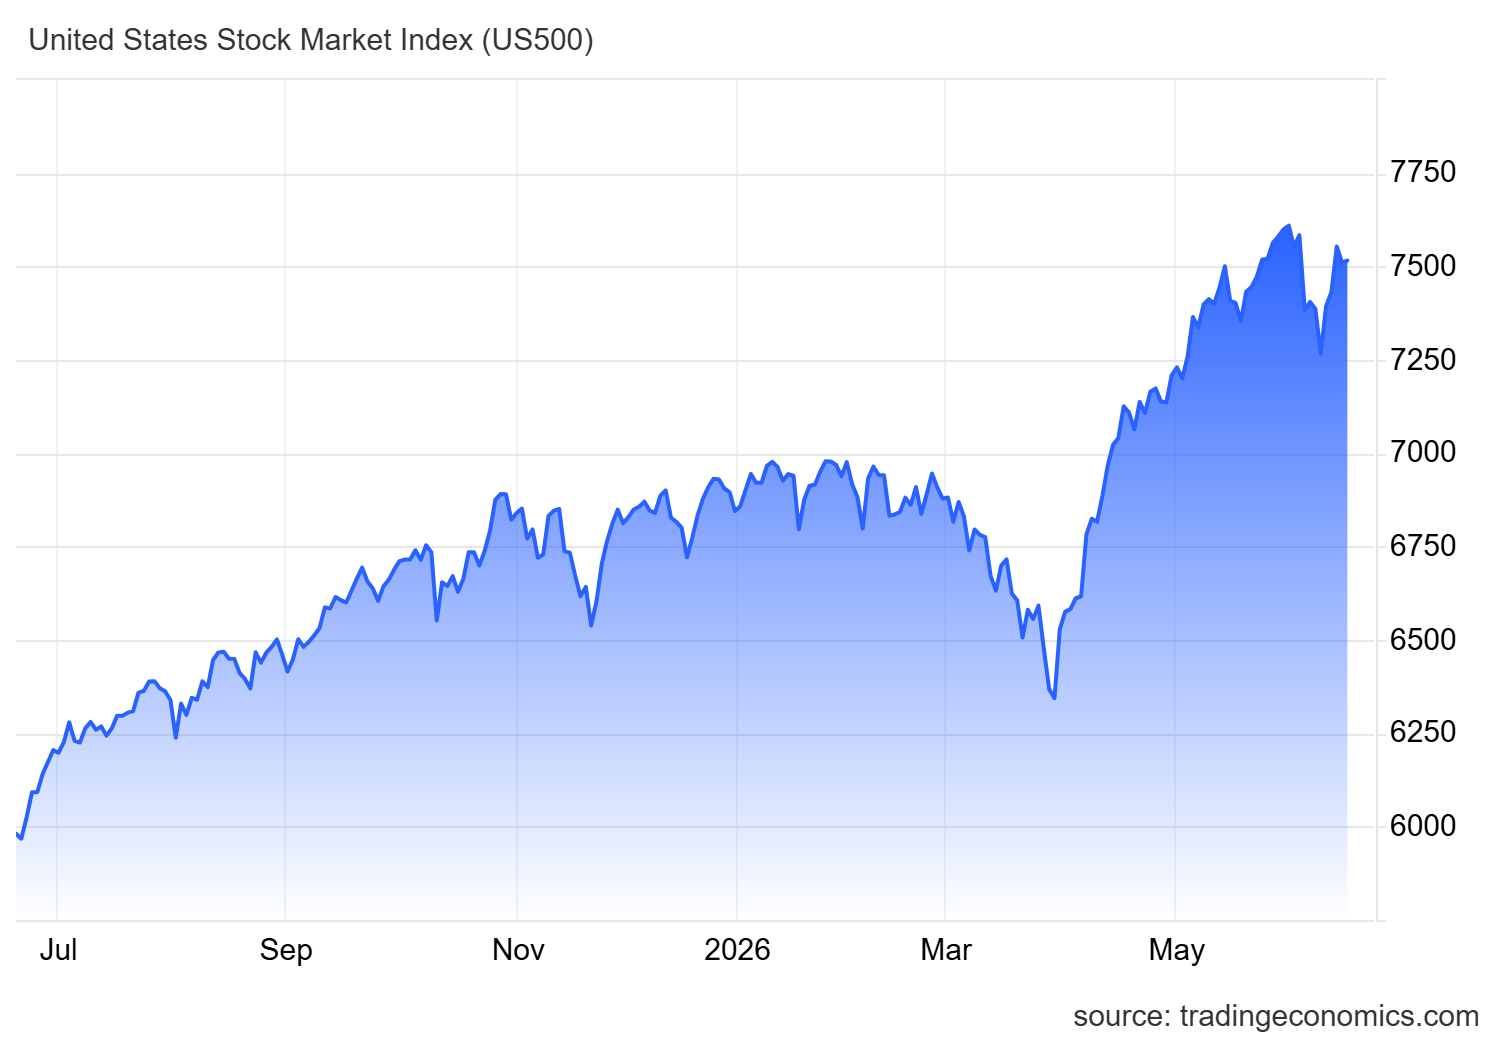
Figure 4. US Stock Market Index, June 2025 - June 2026. Source: Trading Economics
Many prominent market pundits strongly believe that the US equities are in a bubble. For instance, Jeremy Grantham, GMO co-founder, cited “based on the value of the stock market compared to GDP, with modifications, this is the most expensive market in American history”. Using the Buffet Indicator, which measures the total value of the U.S. stock market compared to GDP, Grantham referenced that the market cap to GDP ratio is 235%, meaning that the stock market is worth more than two times the entire U.S. economy. Yet, even at the height of the dotcom bubble, the Buffet Indicator ratio peaked at only 138.46%. Grantham claimed the closest comparable period was the dotcom bubble in 2000.
this trend continues, it would contribute to a decrease in Real GDP as consumer spending slows.
As of now, consumer spending has remained solid, partially thanks to an increase in tax refunds as well as moderate growth in the labor market. In March and April 2026, payrolls increased by 178,000 and 115,000, respectively. Additionally, the year-to-date monthly average job gains for 2026 were 76,000, compared to a year-to-year monthly average of 10,000 in 2025.
Despite the on-paper gains, the job market has been plagued by a “low-hire, low-fire” economy despite an uptick in tech and logistics layoffs in February. A consequence of the “low-hire, low-fire” economy is a surge in long-term unemployment, accounting for approximately one in four unemployed persons. However, despite how Americans may feel about the job market, it is undeniably growing, contributing to the rise in Real GDP.
Government Deficit
The Treasury continues to issue debt to fund federal spending and is expected to issue $574 billion in Q2 and $671 billion in Q3. Theoretically, as the Treasury continues to borrow, yields should rise. However, as individuals and mutual funds begin investing more heavily in Treasuries, the broader buyer base is able to better absorb heavy debt issuances. According to US Bank, inflation uncertainty and geopolitical tensions have more heavily contributed to higher yields than US debt concerns.
Federal Deficit as a Percentage of GDP vs. 10-Year Treasury Yield, 2000–2026
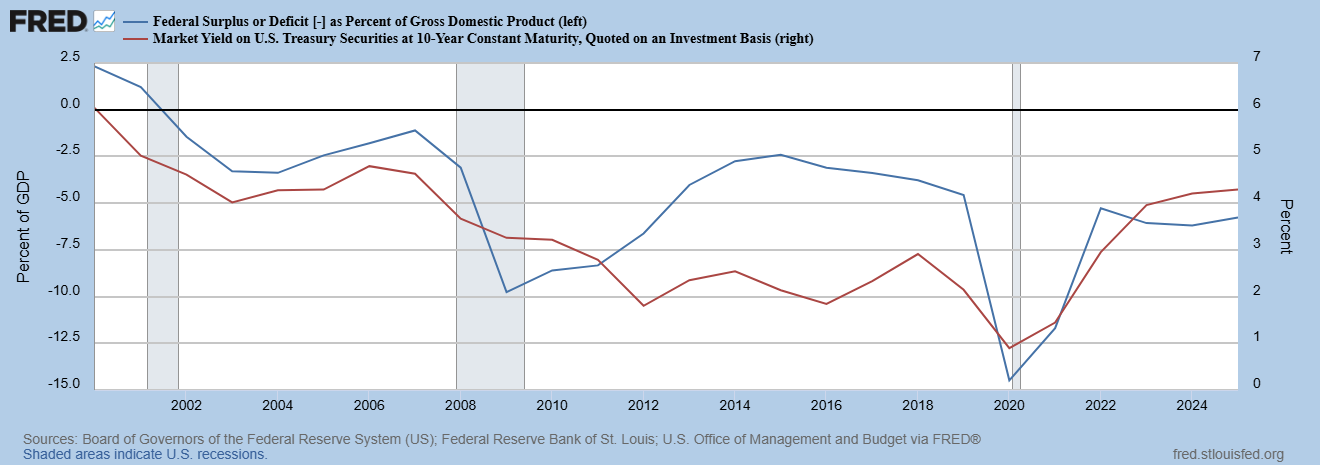
Figure 5. Federal Deficit as a % of GDP vs. 10-Year Treasury Yield, 2000–2026. Source: FRED
Short-War Predictions
With the announcement of the US-Iran memorandum of understanding, the US and Iran have 60 days to negotiate a lasting peace deal. Following the announcement, oil prices and 10-year treasury yields both fell, with Brent crude oil reaching pre-war prices. If the Strait of Hormuz were to remain open, inflation may gradually fall as supply chains heal. This ease in prices allows the Fed to take a wait-and-see approach when evaluating potential rate cuts or hikes, as seen by their June 17, 2026, meeting.
Still, swap traders are pricing in a 70% chance that the Fed will hike rates by a quarter point by December 2026. JPMorgan’s Fabio Bassi expects 10-year treasury yields to rise to 4.7% by year's end. A potential sell-off of US Treasury bonds due to Kevin Warsh cutting the balance sheet would also put upward pressure on yields.
Prolonged-War Predictions
Pre-war term premiums were already at elevated levels thanks to the tariff shocks in 2025.Growth and labor markets remain stable despite the conflict, although slowing growth and a weakening unemployment market, coupled with sticky inflation, are sending the US in a stagflation-lite direction. As the memorandum is too recent, geopolitical concerns will continue putting pressure on investor confidence, and thus term premiums, until a long-lasting peace agreement can be reached.
Many sell-side brokers predict that 10-year treasury yields would hold in the 4.2%-4.5% range this year as inflation remains sticky. Over the course of the war, 10-year yields and oil prices mostly moved together. In the event of prolonged conflict, inflation is unlikely to fall, and yields will maintain their elevated levels, or even rise, depending on the duration of the conflict.Ultimately, if the US-Iran peace deal is successful, inflation concerns will lessen, and term premiums will likely continue to fall as investors become more confident, allowing the Fed to continue its wait-and-see approach. However, core inflation was already on the rise before the war, as inflation had been above the Fed’s 2% target for the past five years. Additionally, if the Fed under Kevin Warsh were to cut its balance sheet this year, yields would have to rise to match demand. If the Fed were to hike rates to combat inflation, coupled with potentially persistent elevated energy prices, it is likely the 10-year yields will remain elevated in the 4.4-4.6%range.
Concluding Remarks
For 5,000 years, gold was humanity's ultimate safe haven. Bitcoin promised a digital alternative. Yet in 2026, investors are selling both to buy AI. Since April, roughly $12 billionhas flowed out of gold and bitcoin funds, while semiconductor funds attracted about $20 billion. The market is redefining what it considers a store of value, shifting from protection to innovation. At the same time, the U.S. 10-year Treasury yield, holding near 4.38%, remains a powerful baseline store of value, offering guaranteed nominal returns that further pull capital away from non-yielding traditional assets. But beneath the headlines, central banks continue accumulating physical gold at an above-average pace.
Retail investors may be chasing the future, while sovereign reserves are still preparing for uncertainty. That divergence is worth watching, especially as the Federal Reserve's decision-making grows increasingly complicated. Led by new Chair, the central bank faces an intricate puzzle: sticky core inflation above 3% and AI-driven productivity booms pull them toward a hawkish stance, while fluctuating energy costs and a cooling global backdrop pressure them to hold rates steady. Navigating this delicate balance between fighting inflation and sustaining growth leaves policy makers with little margin for error.
Danny Guarnieri
Global Markets Analyst
The Beryl Consulting Group
Sources
Carlson (2026), Why Is the 10-Year Treasury Yield So Important?
Vanguard (2025), What Is Bond Yield and Yield to Maturity?
Zucchi (2024), Why the 10-Year U.S. Treasury Yield Matters
Trading Economics (2024), United States Core Inflation Rate
Cox (2026), Consumer Prices Rose 4.2% Annually in May, Highest in Three Years
Dale (2026), Fact Check: Trump Falsely Claims the Inflation Rate Was Just 1.7% Prior to the Iran War
Lee, Meredith, and Kimball (2026), U.S. Crude Oil Briefly Dips Below $70 as Tankers Transit Strait of Hormuz
Burke (2026), Israeli Officials Defiant Over Apparent Inclusion of Lebanon Ceasefire in US-Iran Deal
ABC7 Bay Area (2026), Oil and Gas Supplies Could Take Months to Return to Normal After Iran Deal
Tepper (2025), Federal Funds Rate History 1990 to 2024
Carson (2026), US Bonds Rally as Traders Trim Fed Rate-Hike Bets on Iran Deal
Williams (2026), 2 Ways Jerome Powell's Successor, Kevin Warsh, Intends to Alter the Fed
CNBC, Check Out U.S. 10 Year TIPS’s Stock Price (US10YTIP) in Real Time (n.d.)
Covitz and Engstrom (2026), Why Have Far-Forward Nominal Treasury Rates Increased So Much in the Past Few Years?
CNBC, Check Out U.S. 10 Year TIPS’s Stock Price (US10YTIP) in Real Time (n.d.)
Model Diplomat (2023), Term Premium
FRED Blog (2025), The Term Premium
Federal Reserve Bank of St. Louis (2026), Term Premium on a 10 Year Zero Coupon Bond
FRED Blog (2025), The Term Premium
U.S. Bureau of Economic Analysis (2025), Real Gross Domestic Product
Picchi (2026), Stocks Are Booming Despite the Iran War, Inflation and the Country’s Dour Mood
Trading Economics (2019), Dow Jones Industrial Average | 2019 | Data | Chart | Calendar | Forecast
Frank (2025), The Buffett Indicator: Market Cap to GDP - Updated Chart
Zaidi (2026), Jeremy Grantham Says This Is the Most Expensive Market in “American History.”
U.S. Bank (2024), Are We Going into a Recession?
Jackson (2026), The "Low-Hire, Low-Fire" Economy May Be Starting to Shift
Harring (2026), Long-Term Unemployment Is Surging in the U.S.
U.S. Bank (2023), The Impact of U.S. National Debt on Investments
Federal Reserve Bank of St. Louis (2026), FRED Graph (Accessed June 17, 2026)
Schwab Brokerage, Fixed Income Outlook: Bonds Are Back (n.d.)
Carson (2026), US Bonds Rally as Traders Trim Fed Rate-Hike Bets on Iran Deal
Williams (2026), 2 Ways Jerome Powell's Successor, Kevin Warsh, Intends to Alter the Fed
Schwab Brokerage, Fixed Income Outlook: Bonds Are Back (n.d.)
Kopack (2026), Oil Prices Fall on Iran Peace Deal, but May Not Go Much Lower
Schwab Brokerage, Fixed Income Outlook: Bonds Are Back (n.d.)


Market Recap 06/15/25
Commodities are now up 17% year-to-date as Gold hits a record high as oil prices spike. Geopolitical tensions are escalating, fiscal imbalances are deepening, interest rates are under pressure to fall, and central banks continue to accumulate gold at an historic pace.
U.S. equities declined over the week, with the Dow Jones Industrial Average falling 1.32%, slipping back into negative territory for the year. The S&P 500 and Nasdaq saw more moderate declines and remain positive year-to-date.
Markets were broadly higher through Thursday, lifted by upbeat economic data and reports of progress in U.S.-China trade talks. However, sentiment reversed sharply Friday following news that Israel launched airstrikes targeting Iranian nuclear sites and military leadership, triggering a retaliatory response from Iran later that day.
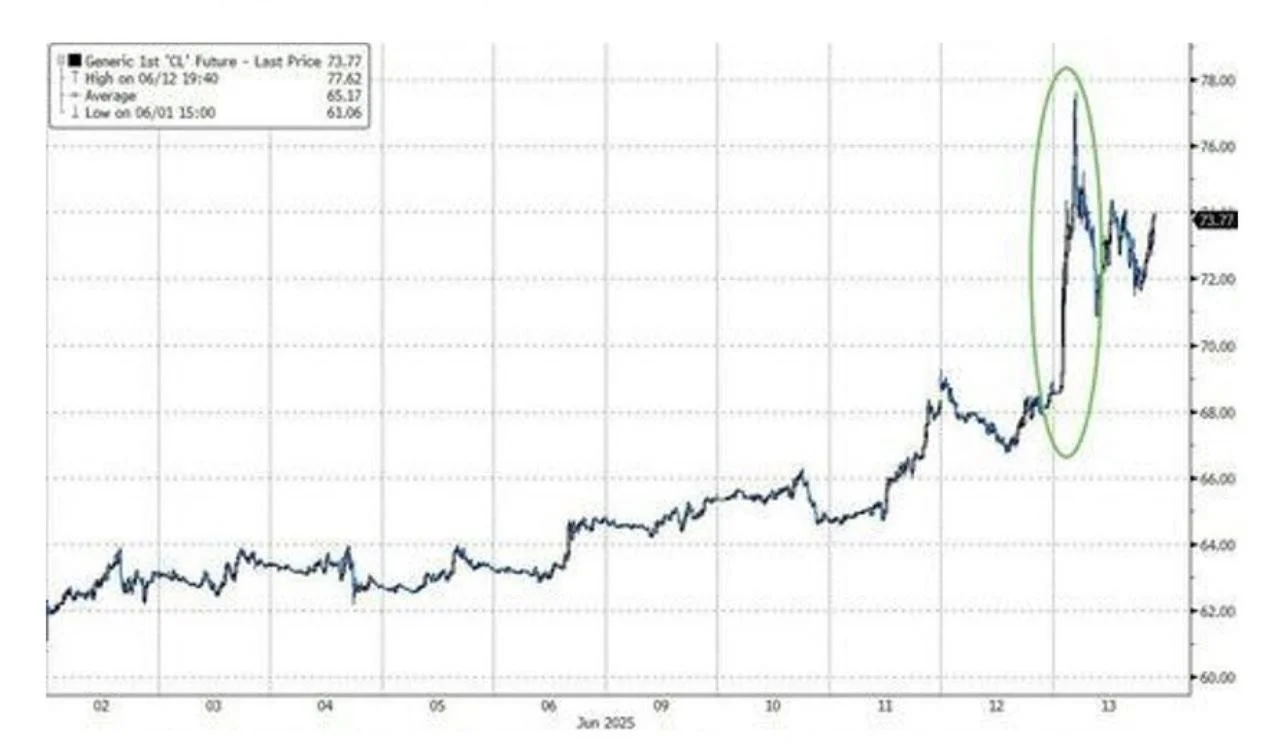
This marked a major escalation in Middle East tensions and sent oil prices surging +8%—the largest one-day gain since March 2022 during the onset of the Russia-Ukraine war. Energy stocks rallied, while broader markets gave up the week’s earlier gains. The VIX spiked above 20, and gold closed at an all-time high amid a rush to safe-haven assets.
While U.S. Treasury yields finished lower for the week, safe-haven bids were tempered by inflationary concerns stemming from risks to oil supply via the Strait of Hormuz. The U.S. dollar weakened overall, despite some late-week strength. In Europe, the STOXX Europe 600 Index dropped 1.6% on geopolitical jitters. Bitcoin pulled back to $105K on Friday.
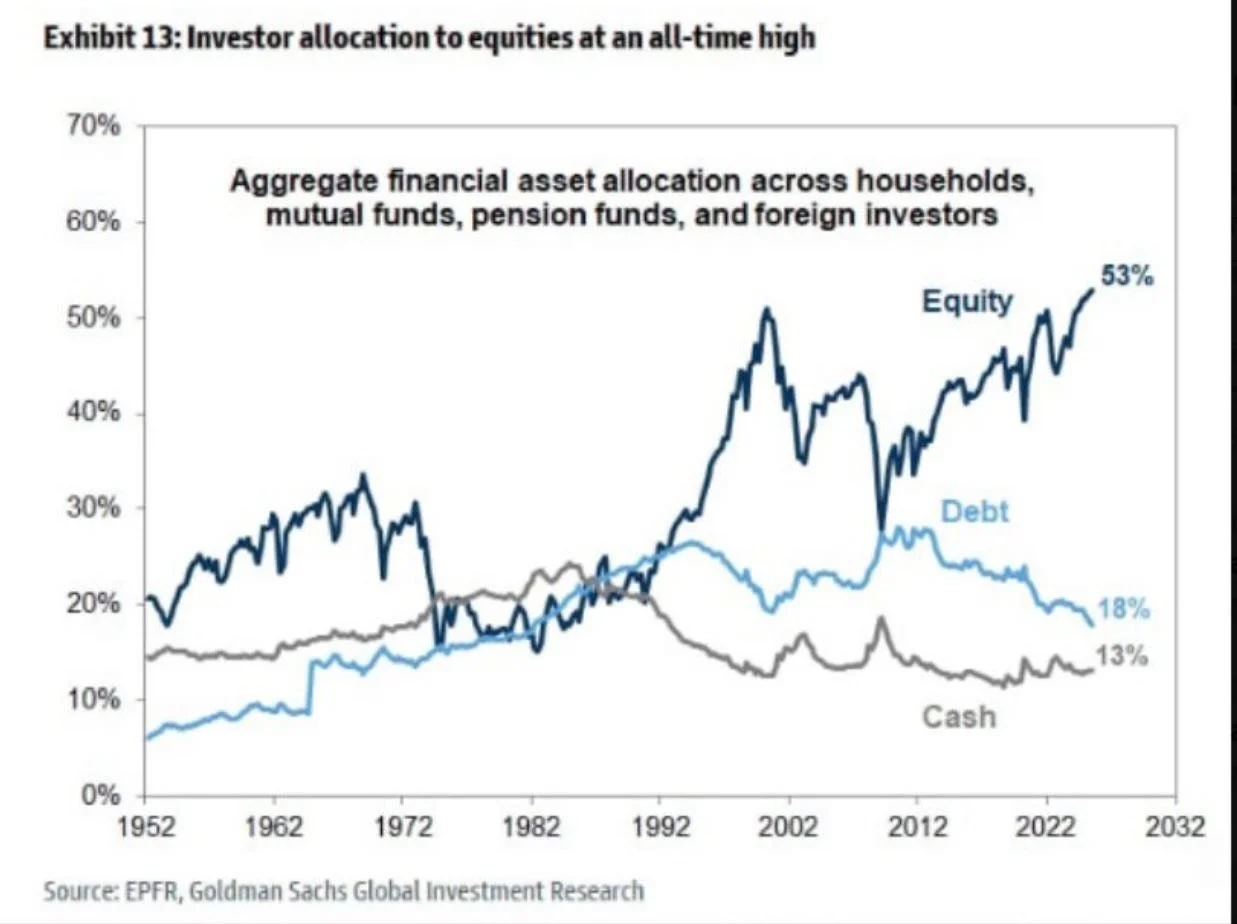
You can also read our past market insights here.Equity exposure is at record highs
Investor allocations to stocks are now at the highest level ever recorded—surpassing even the peak just before the dot-com bubble burst.
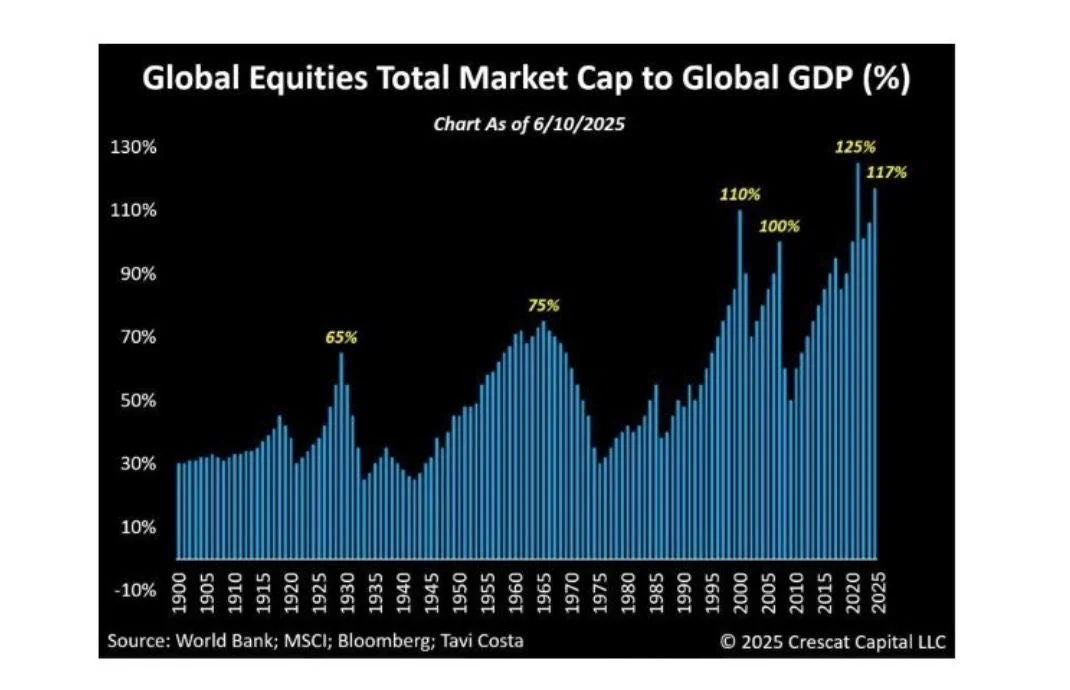
markets are historically expensive
Global equities are in their second most overvalued year in history based on the market cap-to-GDP ratio. The only time valuations were higher was in 2021. The so-called “Buffett Indicator” has surged to 200%, just shy of its all-time peak.
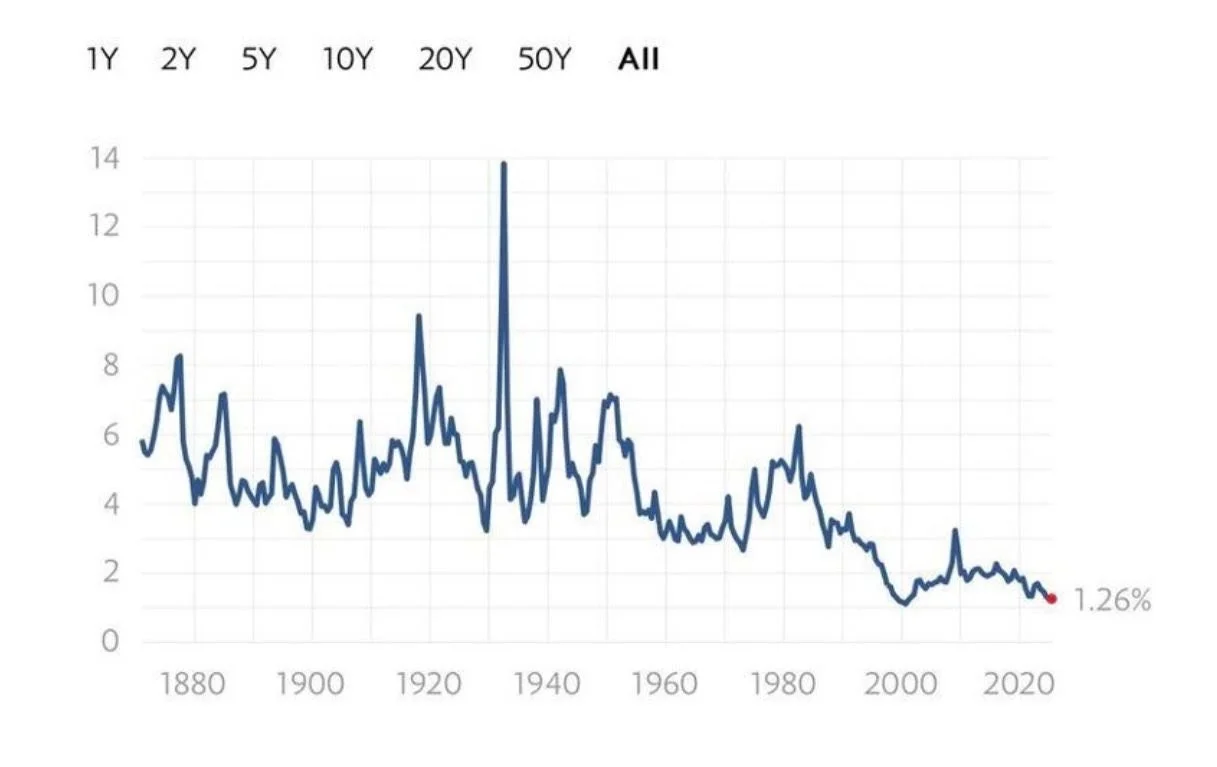
Yield compression continues
The S&P 500 dividend yield has fallen to just 1.26%, approaching all-time lows.
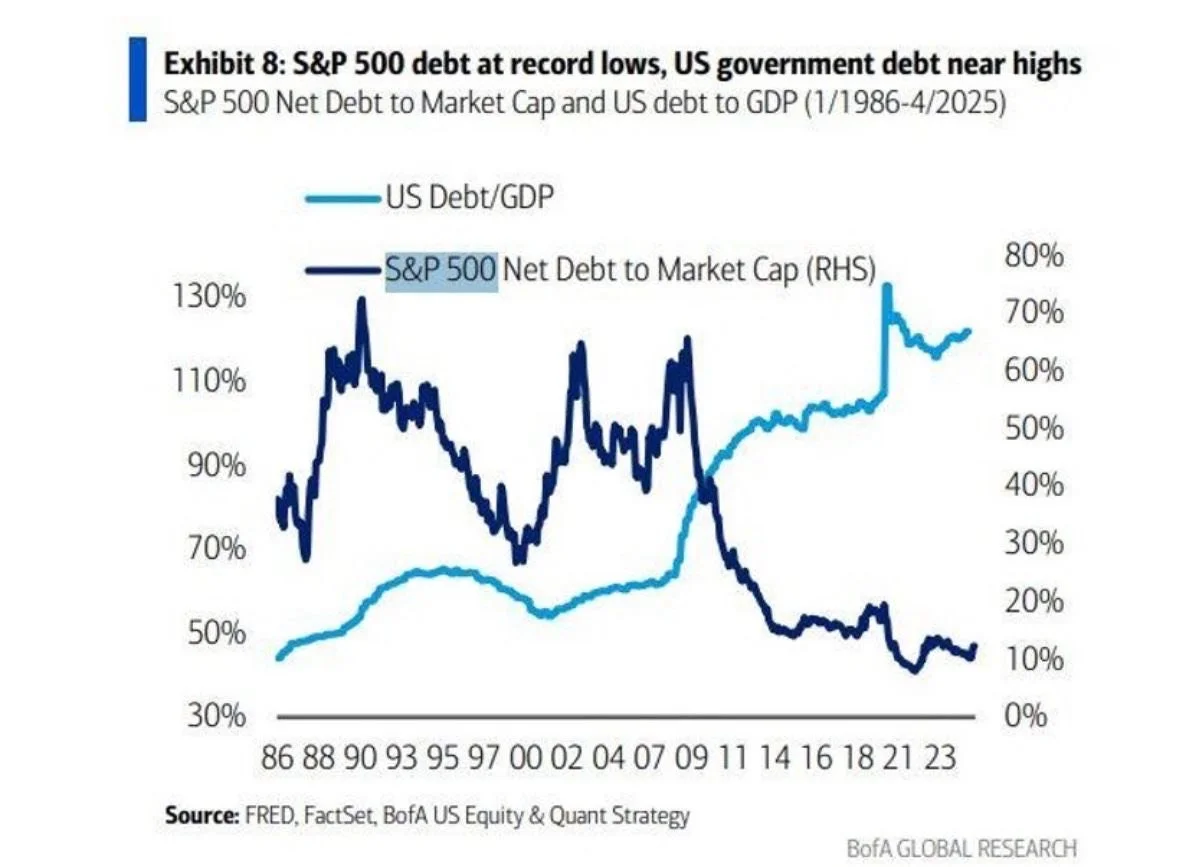
Debt divergence is growing
While S&P 500 corporate debt levels are at record lows, U.S. government debt continues to climb to record highs.
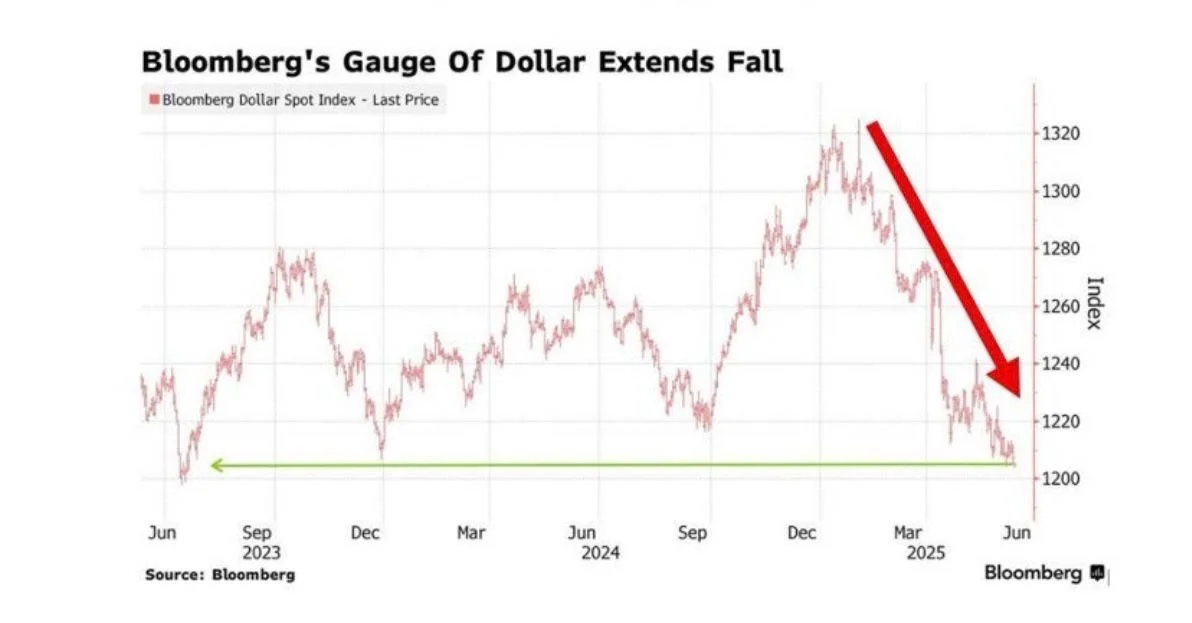
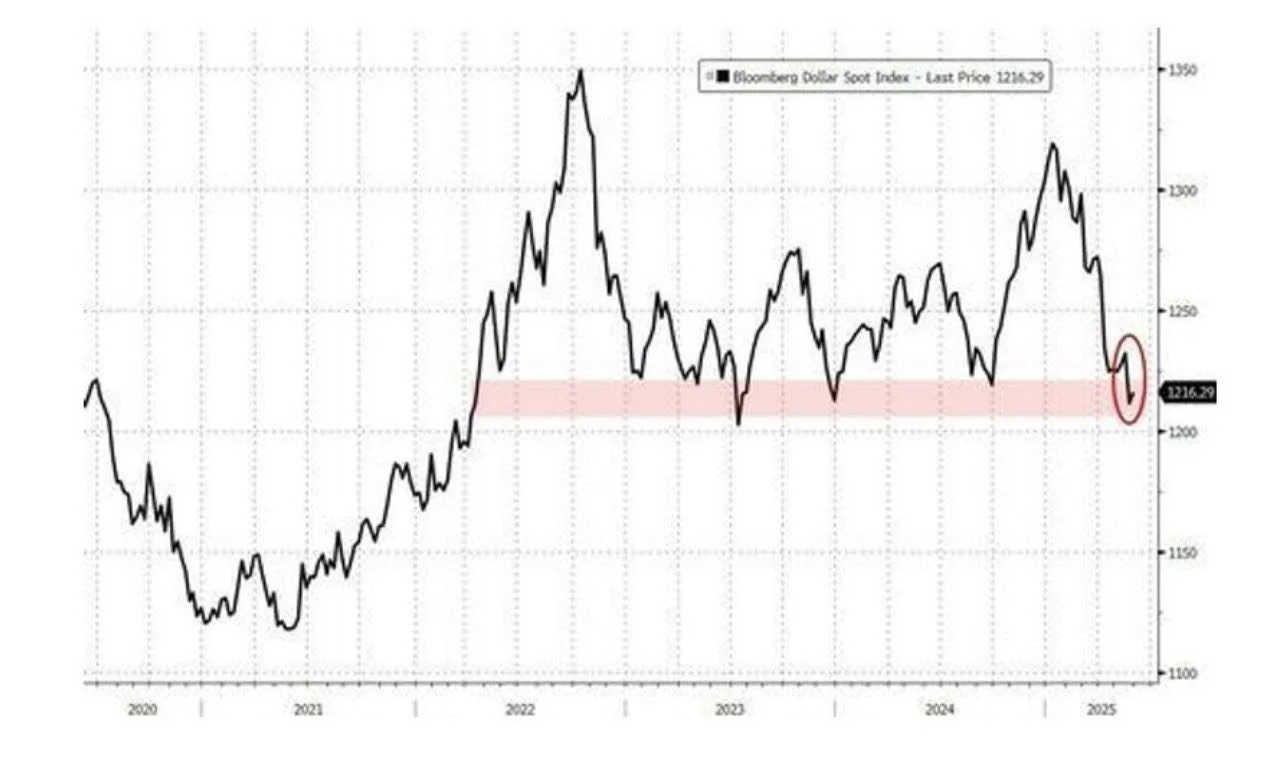
the us dollar is under pressure
The greenback has declined 8% year-to-date, wiping out all gains from the past 12 months, as foreign investors repatriate capital.
oil spikes on Geopolitical risk
Friday’s 8% surge in WTI crude was the largest one-day gain since March 2022—following Russia’s invasion of Ukraine.
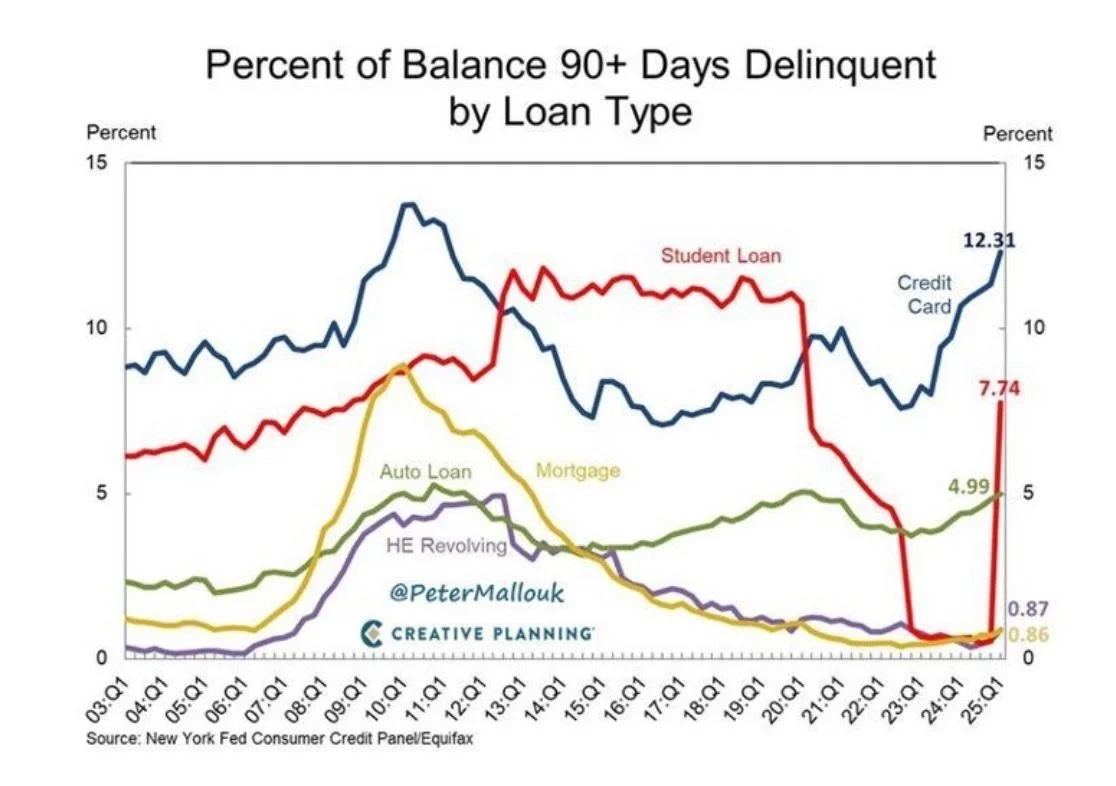
us consumer credit is flashing red
Over 12% of credit card balances are now over 90 days delinquent—the highest rate since 2011. The average interest rate on this debt stands at a staggering 21%.
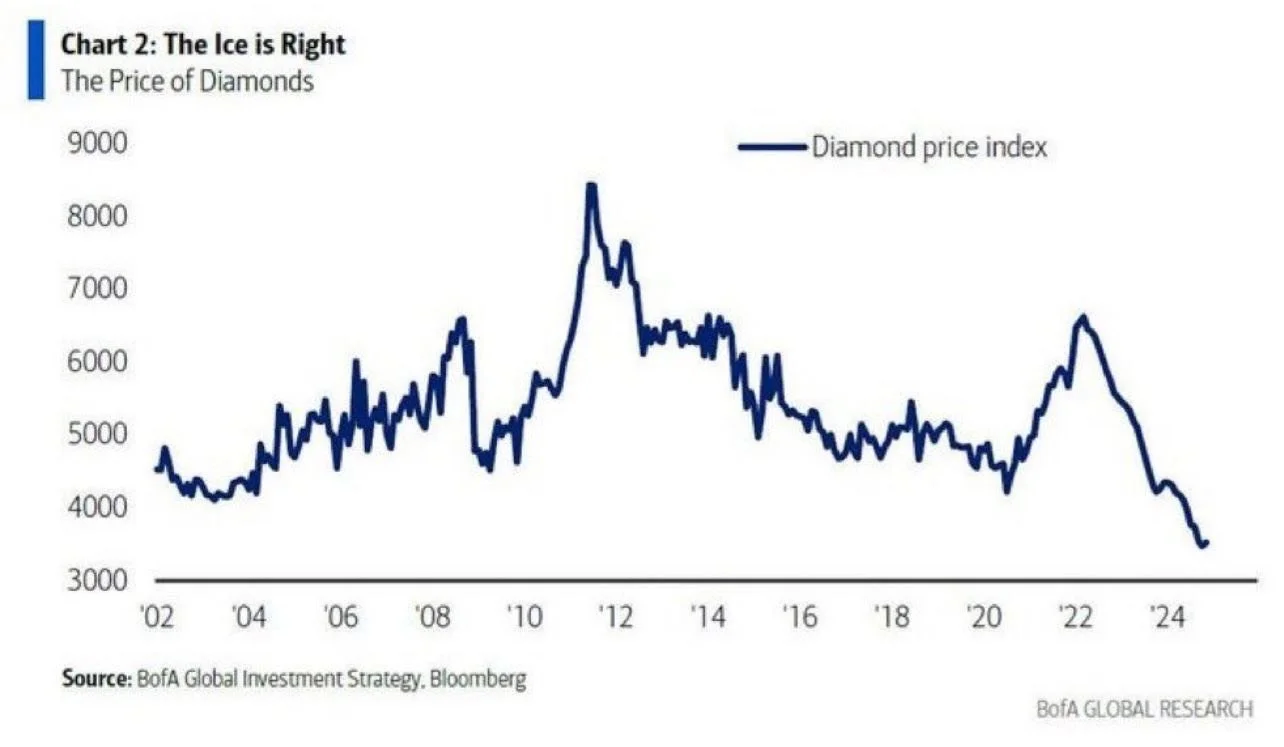
diamonds might sparkle…but…
Diamonds have lost their shine for investors. Prices have dropped to their lowest levels this century. Competition from synthetic diamonds?
Market Recap 06/01/25
U.S. equities finished higher in the holiday-shortened week, though gains were tempered by late-week selling. The Nasdaq led with a 2.01% rise, followed by the S&P 500, which climbed 1.88%. Small-cap stocks underperformed.
Markets opened strong after President Trump announced a delay in the implementation of a new 50% tariff on EU imports until July 9. Optimism surged midweek when the U.S. Court of International Trade ruled that the president lacked authority to impose most of the global tariffs introduced since his second term began. This triggered a sharp rally on Thursday morning. However, investor enthusiasm faded after the administration appealed the decision, and a federal appeals court placed a temporary hold on the ruling later that day.
Trade-related uncertainty resurfaced after Treasury Secretary Bessent noted that U.S.-China negotiations were “a bit stalled,” and President Trump accused China of violating a preliminary trade agreement—adding to cautious sentiment heading into the weekend.
On the economic front, core PCE inflation for May eased, while consumer confidence showed improvement. U.S. Treasuries rallied in response to the court ruling on tariffs. European and Japanese markets rose, while Chinese equities fell. Meanwhile, gold and bitcoin trimmed earlier gains, and the U.S. dollar strengthened.
We’re skeptical that May’s market momentum will continue. While the worst-case scenario around ‘liberation day’ tariffs may be behind us, markets now seem priced for the best case. Investors will be watching this week’s data closely, especially Friday’s May nonfarm payrolls, for signs of how tariffs are impacting the U.S. economy.
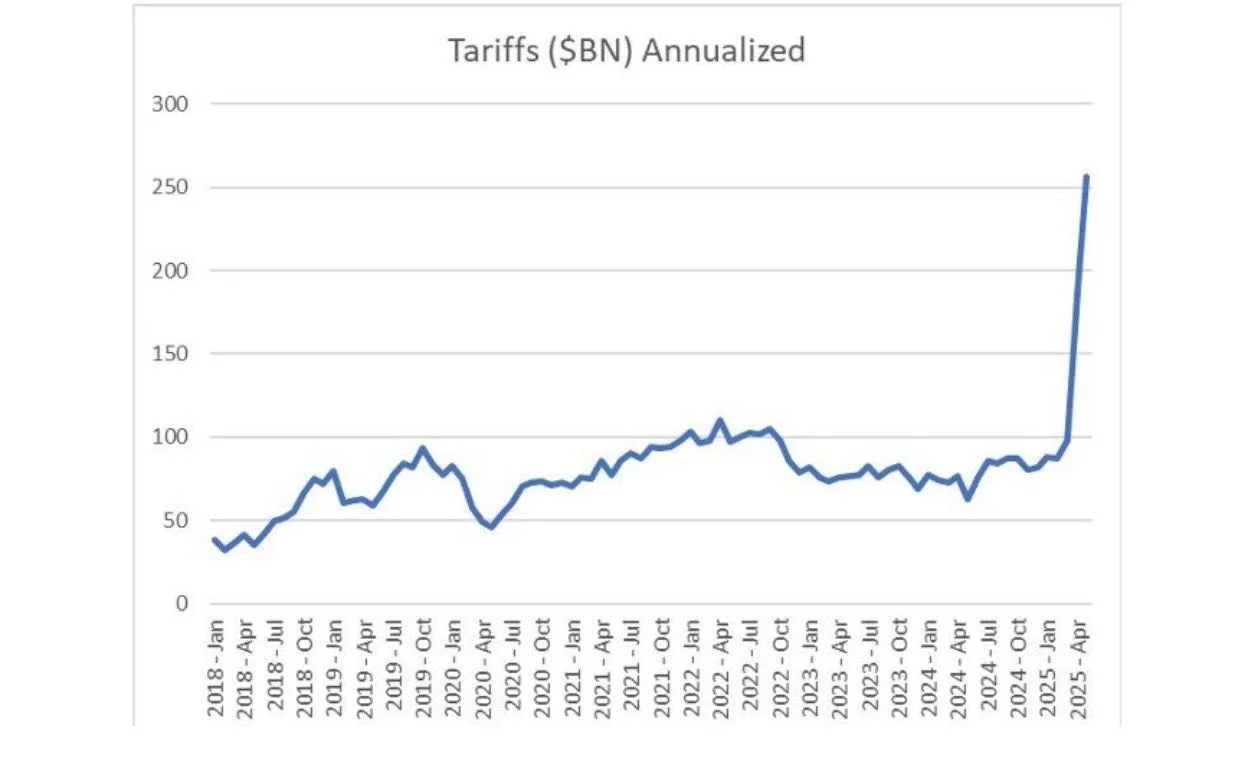
You can also read our past market insights here.Tariff Revenues Soar
The U.S. government is now generating roughly $255 billion annually from tariffs imposed during the Trump administration.
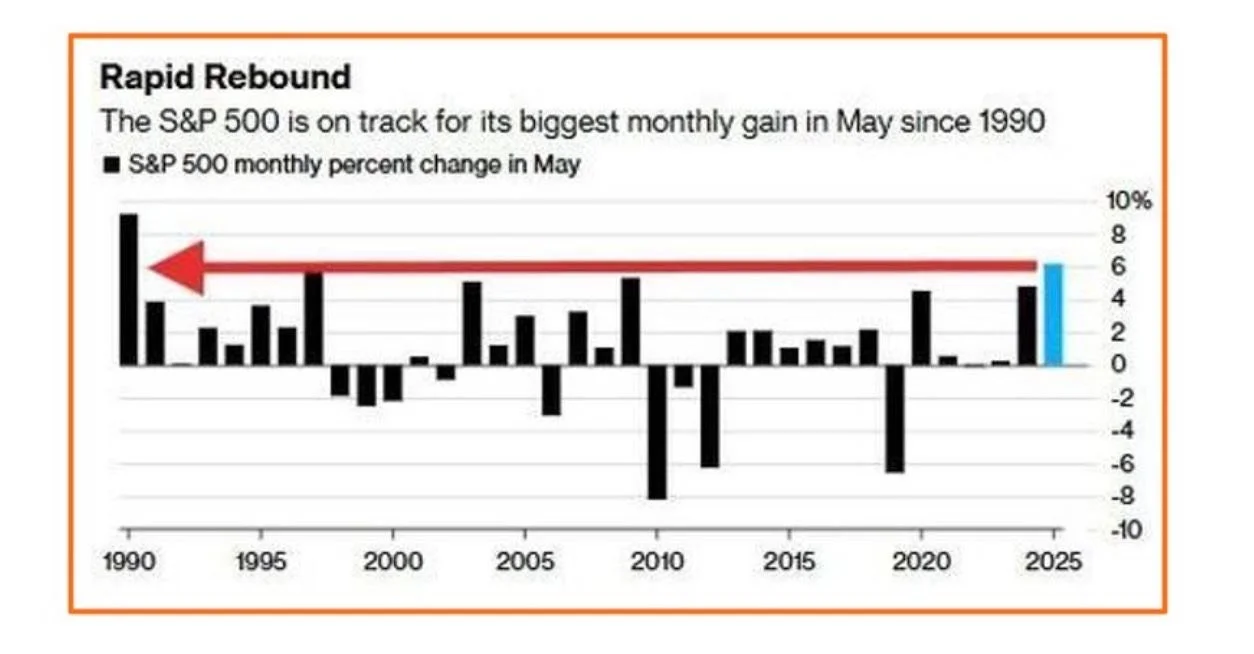
Strongest May in Decades
The S&P 500 just posted its best May performance in 35 years, marking its strongest monthly gain since the November 2024 election.
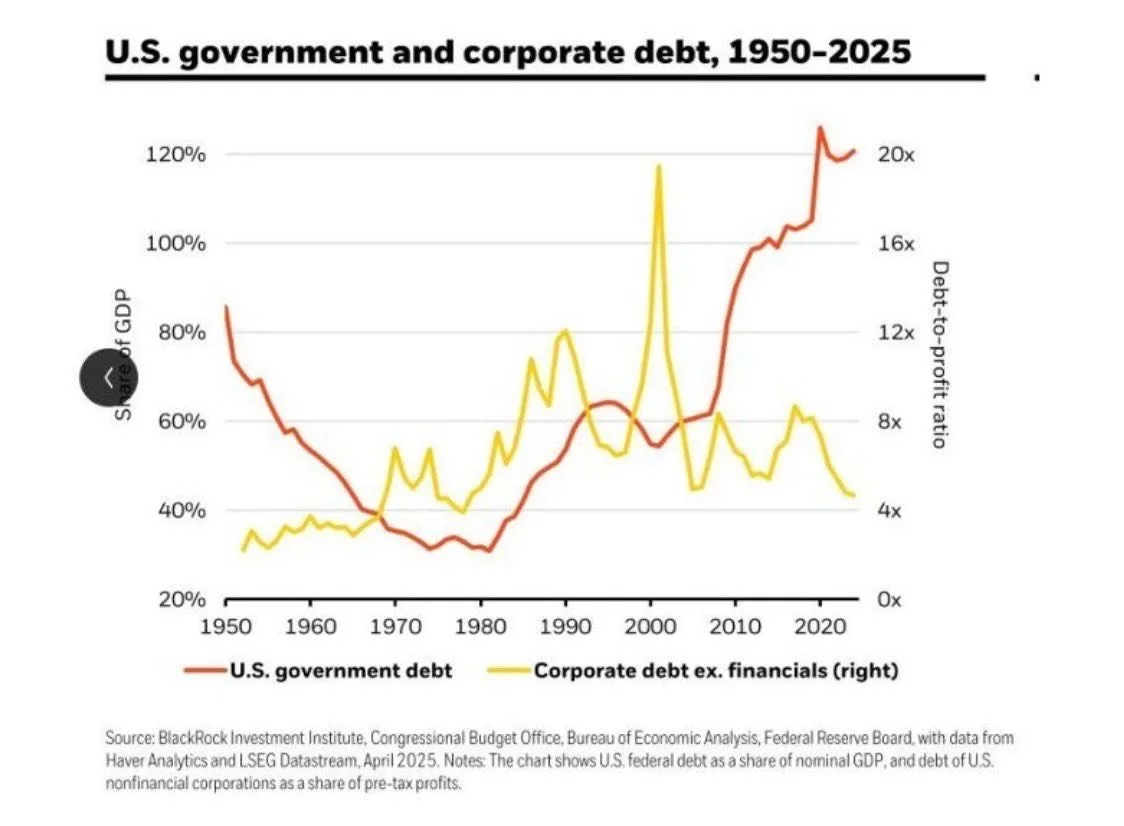
U.S. Debt Divergence
U.S. government debt continues to surge, raising concerns of a potential sovereign debt crisis. In contrast, corporate balance sheets remain healthy. This divergence supports a preference for corporate debt in fixed income investing.
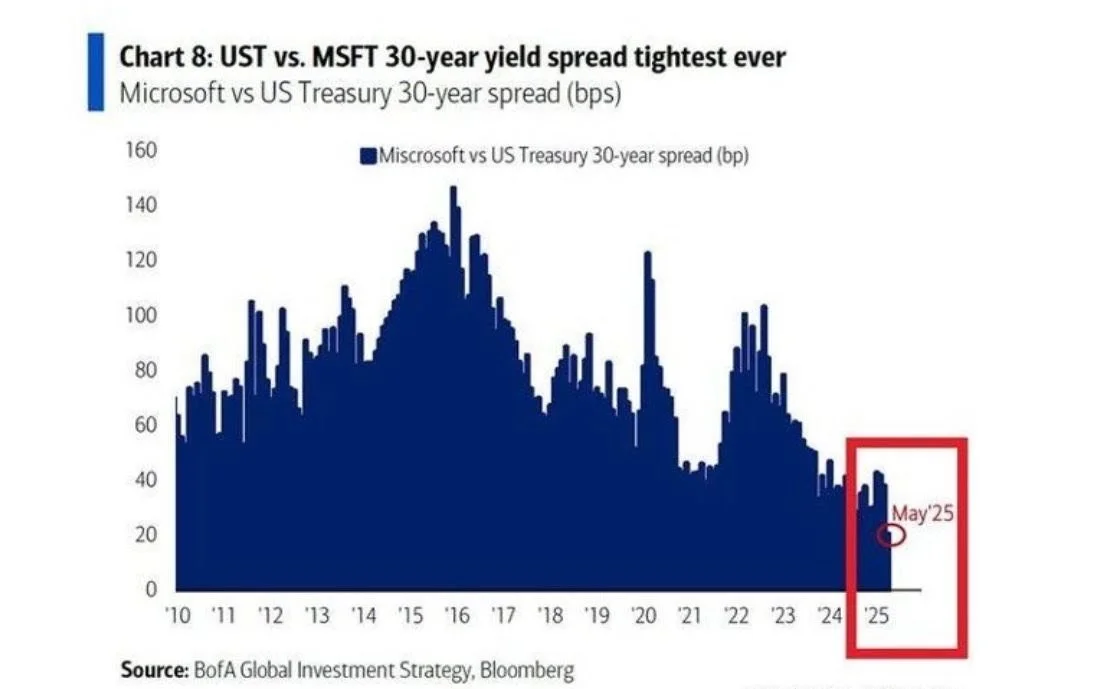
Microsoft’s Bonds Nearly Risk-Fr
The yield spread on Microsoft’s 30-year bonds over equivalent U.S. Treasuries has dropped to just 20 basis points, the lowest on record—implying Microsoft’s credit is nearly as safe as the U.S. government’s.
Dollar Under Pressure
The U.S. dollar has declined for five straight months, now testing support levels not seen in three years.
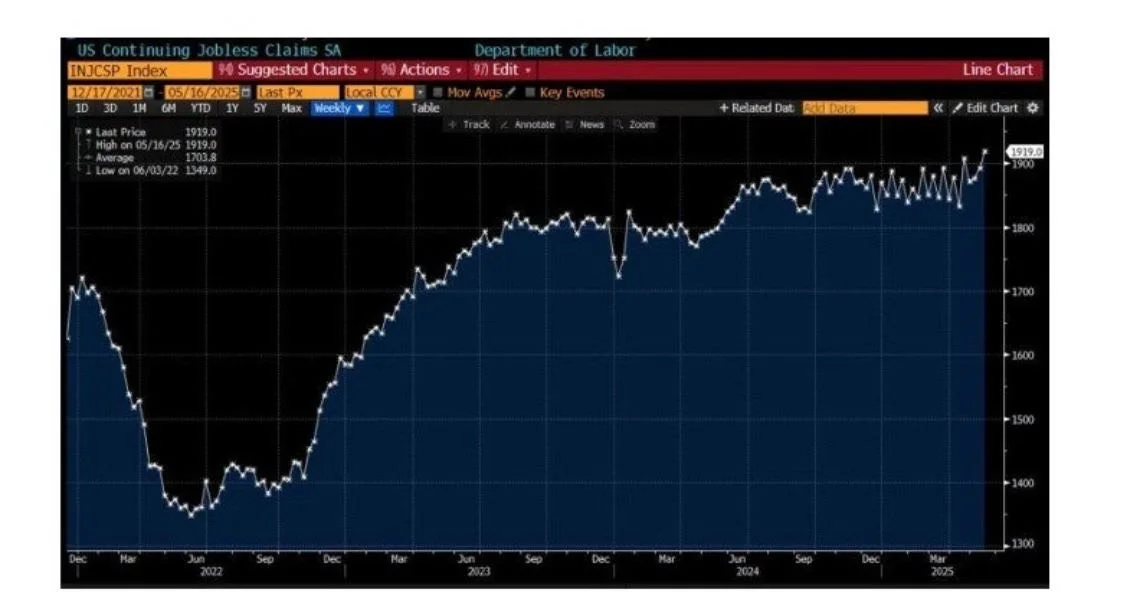
jobless claims rising
Continuing jobless claims in the U.S. have climbed to their highest level since 2021, indicating it’s taking longer for people to re-enter the workforce.
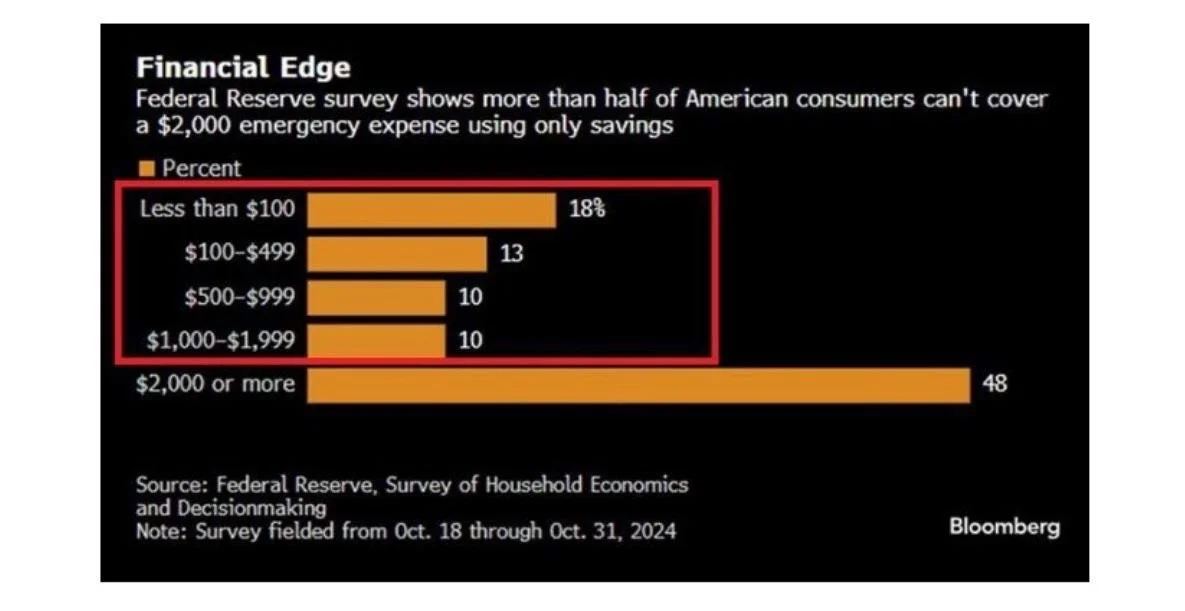
americans are financially fragile
A new Federal Reserve survey shows that over 50% of U.S. consumers cannot cover a $2,000 emergency from savings alone, and nearly one-third can’t even manage $500.
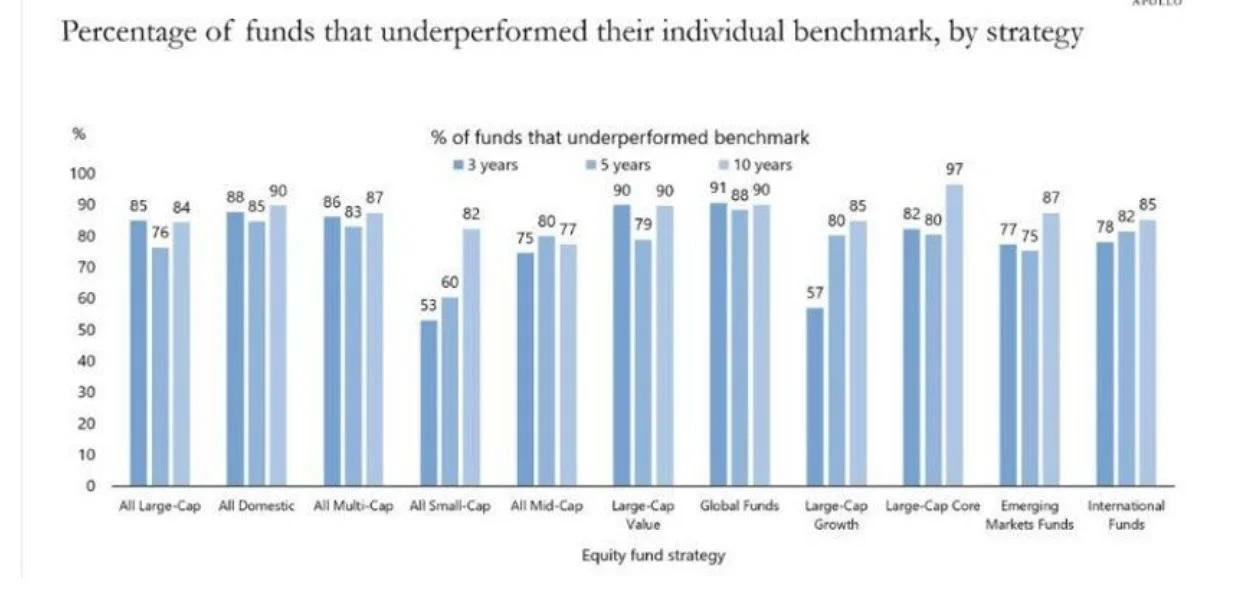
active managers consistently lag
According to S&P Global, 80% to 90% of active fund managers have underperformed their benchmarks over the past decade. The chart below highlights the persistent struggles of active management across all strategies.
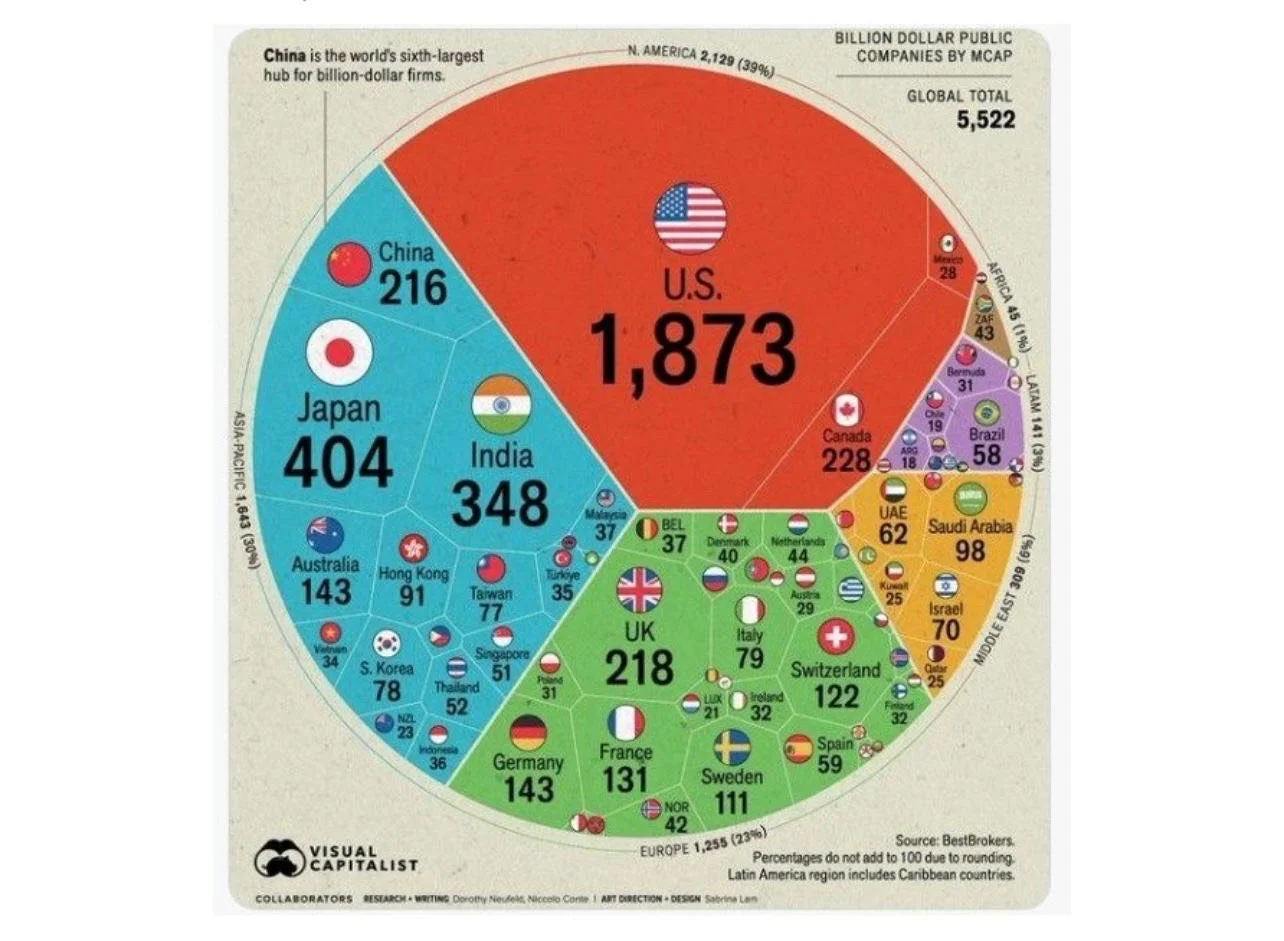
america’s corporate dominance
There are 1,873 billion-dollar companies based in the U.S., far ahead of Japan (404) and India (348)—a testament to American corporate scale and innovation.
buffett on American strength
“Don’t bet against America,” says Warren Buffett. With just 4% of the global population, the U.S. continues to lead the world in innovation, talent, capital, and influence.
buffett on time as the ultimate asset
“I can buy anything I want, basically, but I can’t buy time.”
– Warren Buffett.
A timeless reminder that time is life’s most limited and valuable resource.

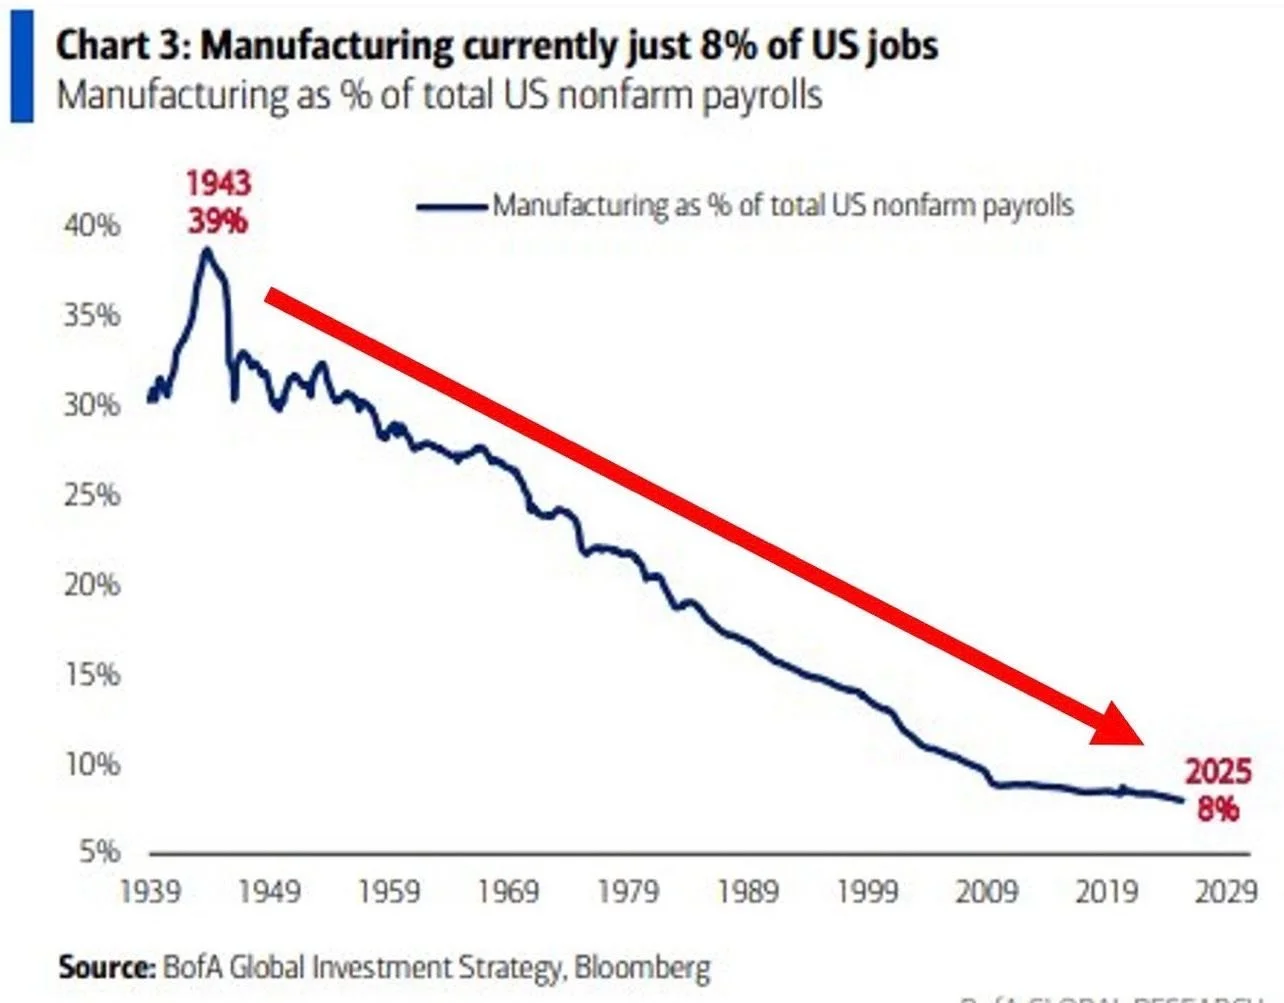
Decline in U.S. manufacturing employment
The decline in U.S. manufacturing employment has been striking. This long-term structural trend has been driven by a combination of factors, including globalization and trade policy shifts, rapid technological progress, increased automation, and a broader transition toward a service-based economy.
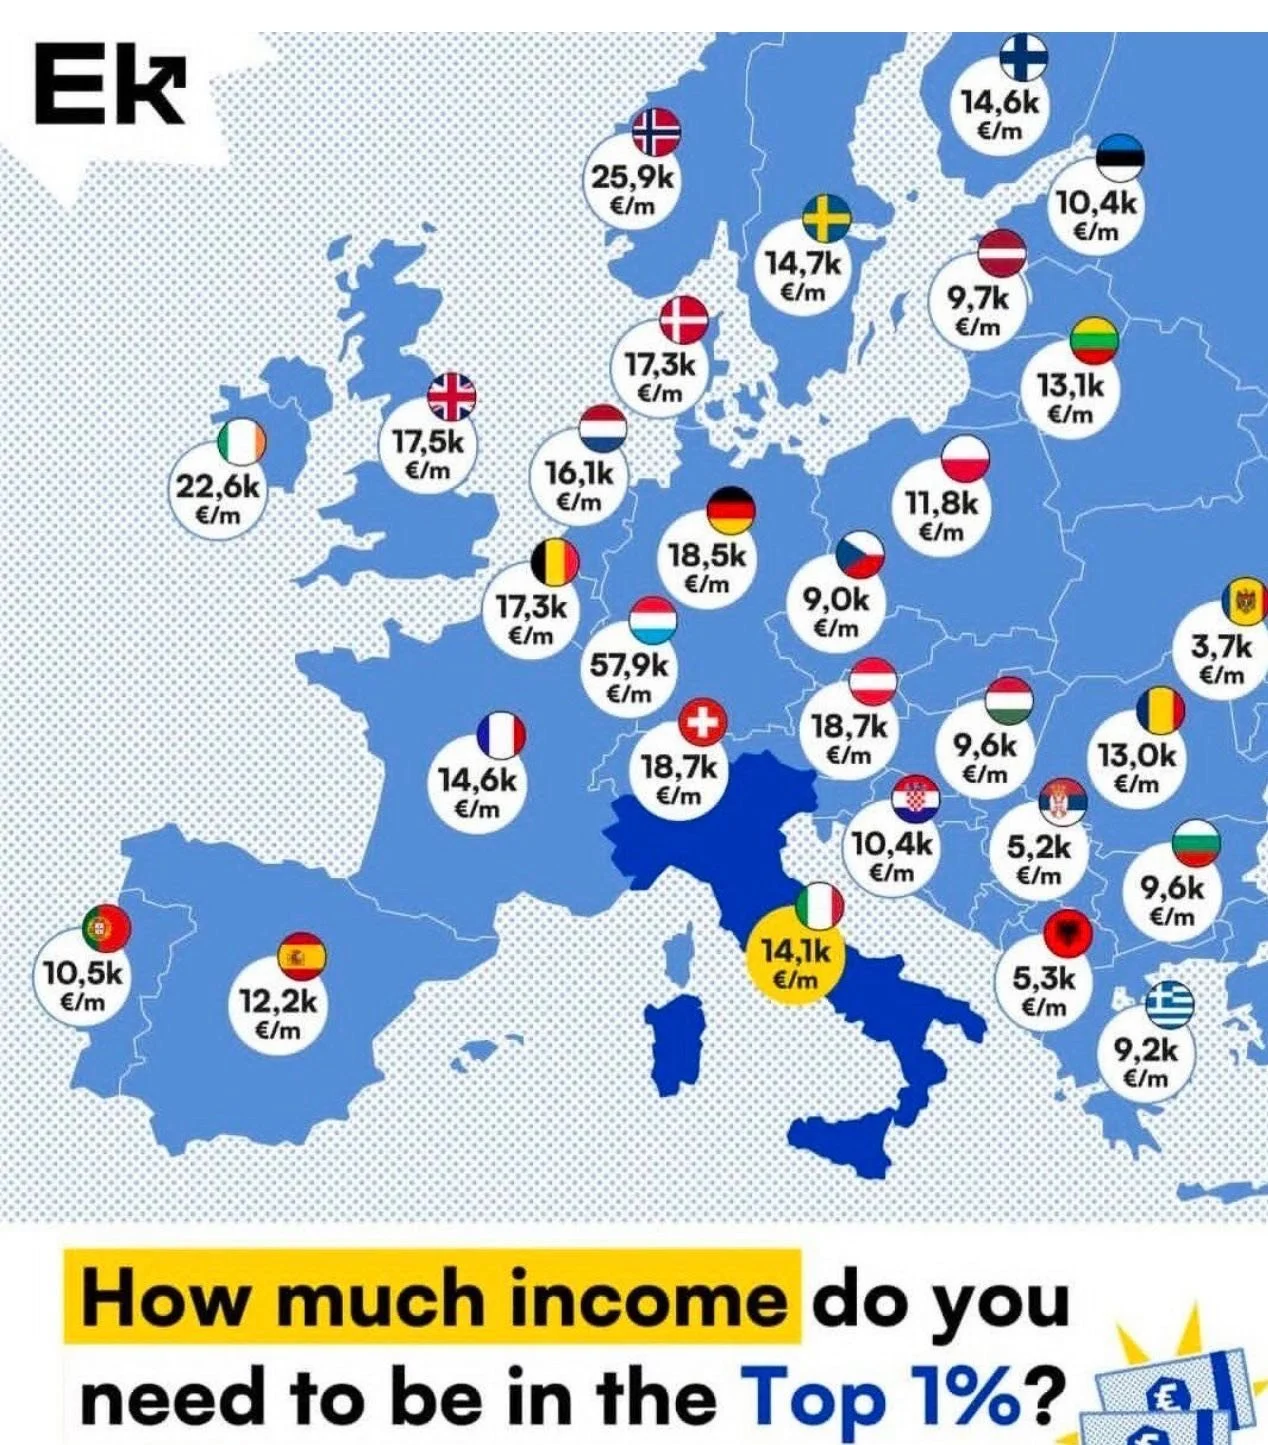
What It Takes to Be in the Top 1% in the U.S.
For context, reaching the top 1% of earners in the U.S. requires an income of approximately $66,000 per month (€58,000).
macro hedge funds
Macro hedge funds are off to their worst start to a year on record, challenged by volatile markets, shifting central bank policies, and changing trading dynamics. In a landscape shaped by AI and rapid capital flows, adaptability—not just recovery—is the real test.

Market Recap 04/21/25
U.S. equity markets ended the holiday-shortened week with mixed results. Small-cap stocks outperformed, with the Russell 2000 Index recording gains, while the Dow Jones, S&P 500, and Nasdaq Composite all finished lower. The technology sector was a notable laggard, pressured in part by news that the U.S. government plans to tighten restrictions on chip exports to China.
Sentiment was further dampened by hawkish remarks from Federal Reserve Chair Jerome Powell later in the week. Both the S&P 500 and Dow Jones are down ~10% YTD. Currently, the S&P 500 and NASDAQ are trading below their 50- and 200-day moving averages, signaling increased risk. With trade tensions escalating and uncertain earnings guidance, we could be stuck in a high-risk, low-reward market until a clear catalyst emerges.
On the economic front, U.S. consumer spending rose 1.4% year-over-year in March—the largest monthly increase in over two years—as buyers rushed to purchase vehicles ahead of the Trump administration’s planned 25% tariff on auto imports. In the bond market, Treasury yields declined across the curve, with the belly outperforming and the long end trailing. Powell’s warning about the unexpectedly large scale of tariffs and his pushback against the notion of a “Fed Put” contributed to risk-off sentiment, bolstering Treasuries.
In Europe, the European Central Bank cut its key deposit rate by 25 basis points to 2.25%, in line with expectations, and signaled further easing. The STOXX Europe 600 Index advanced 3.93% for the week.
You can also read our past market insights here.Currencies
The U.S. dollar declined for a third consecutive week, hitting its lowest level since early October. The Dollar Index has now fallen over 3.6% since Liberation Day. The dollar has weakened ~8% YTD. In contrast, the Euro, Yen, and Swiss Franc are each up over 10%.
Gold, Bitcoin & Commodities
Crude oil prices surged, and gold soared to fresh all-time highs. Gold has now gained 26% year-to-date, marking its strongest performance in more than two decades. Bitcoin also posted its second straight week of gains. It is still down 9% YTD.
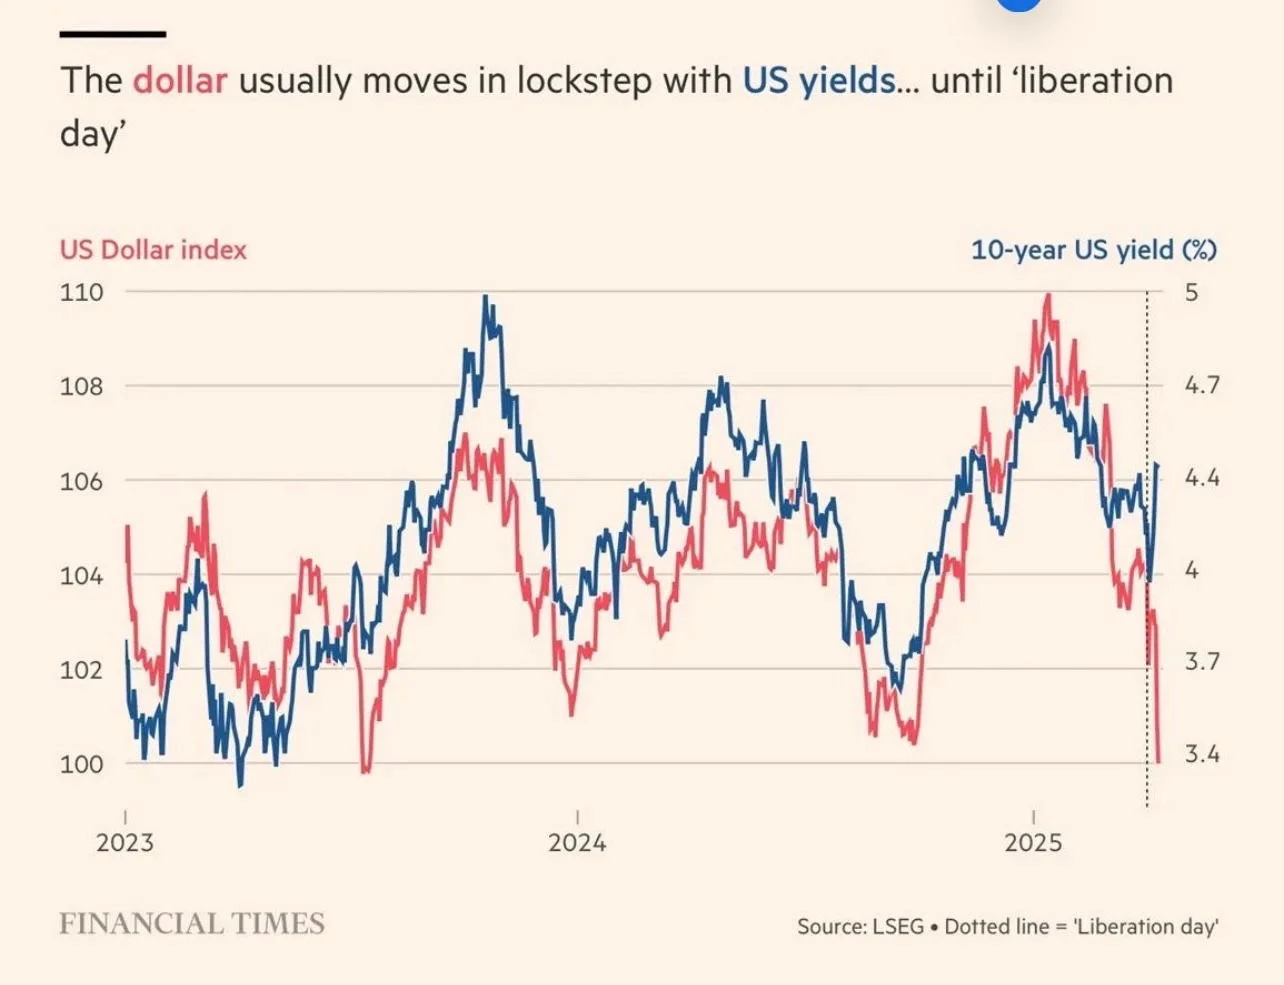
US$ index & UST 10-Year Yield Conundrum
The divergence between the USD Index and 10Y Yield doesn't scare you, then you're one step behind. Investors are selling treasuries and moving their money outside of USD.
Generally these two move in sync since Treasuries are seen as risk-free. When the yield goes up, investors want to lock into the higher rates. This increases the demand for the dollar, which means the USD index and the yield move in sync.
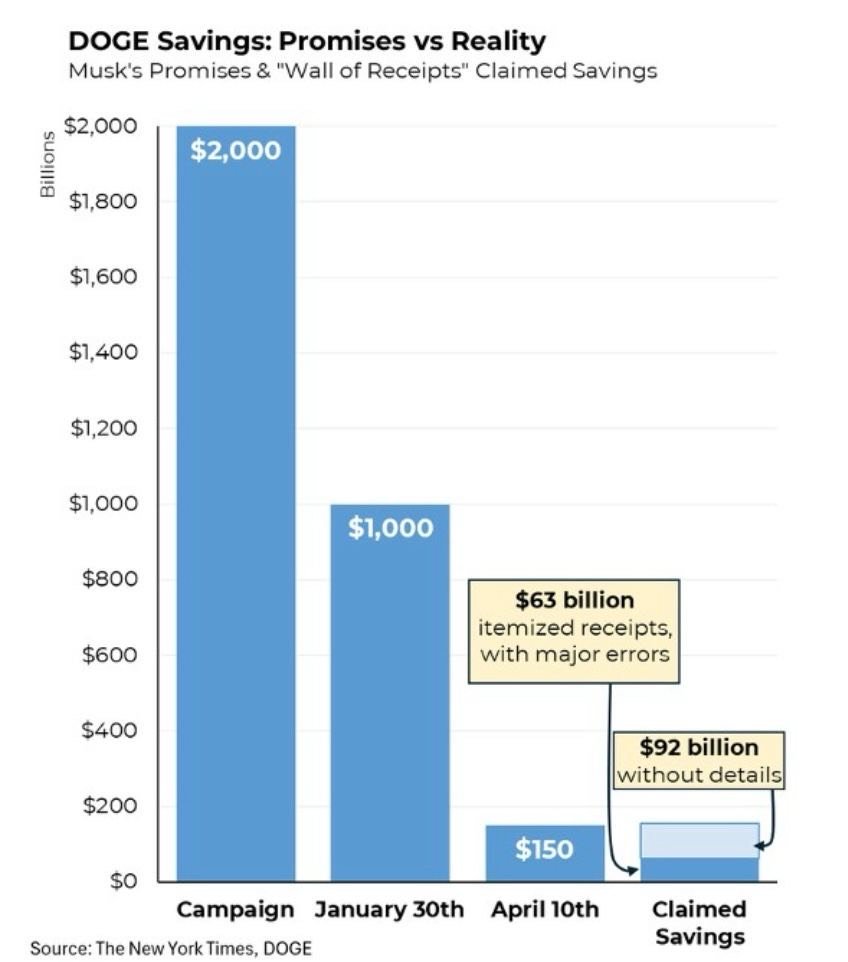
DOGE Savings: Promises vs Reality
The cost-cutting goals are getting exponentially smaller underscoring the challenges of applying corporate cost-cutting strategies to the complex structure of government.
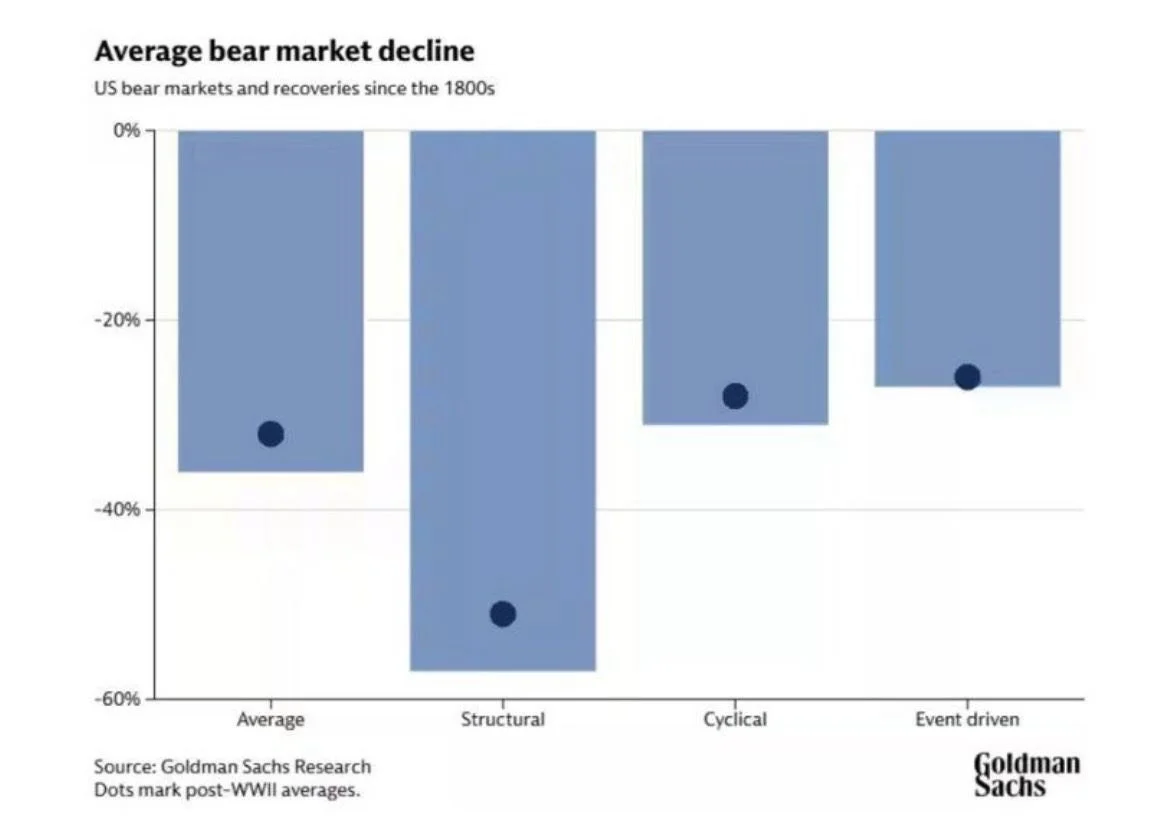
Categories of Bear Markets
“There are three district categories of Bear Market”
Goldman Sachs Research
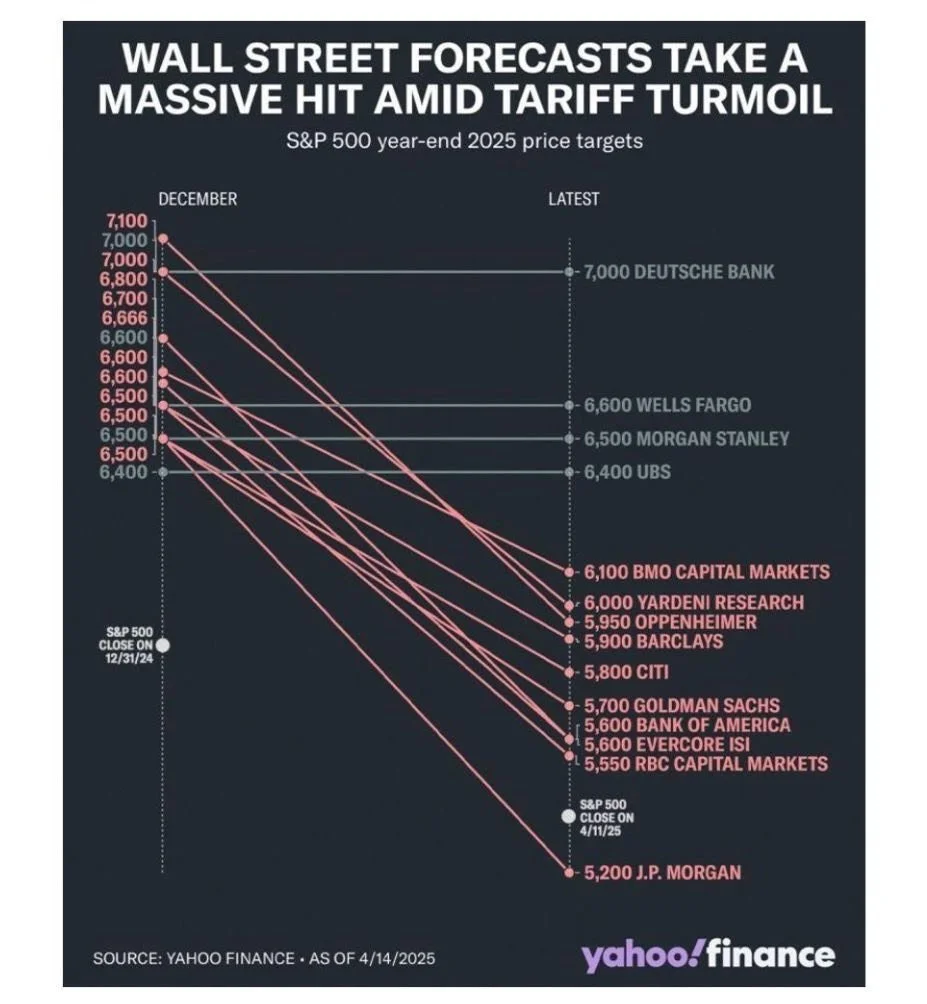
S&P 500 Year-End Targets
Here is how Wall Street’s 2025 year-end targets for the S&P 500 changed.
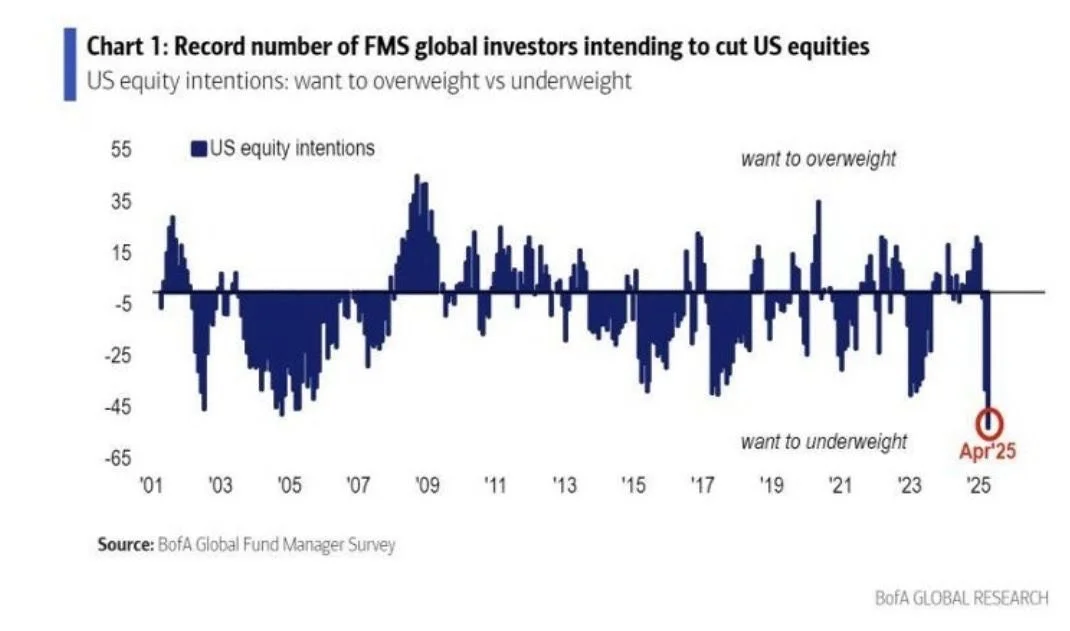
investors Sentiment
April may have marked the bottom of Anti-US sentiment?
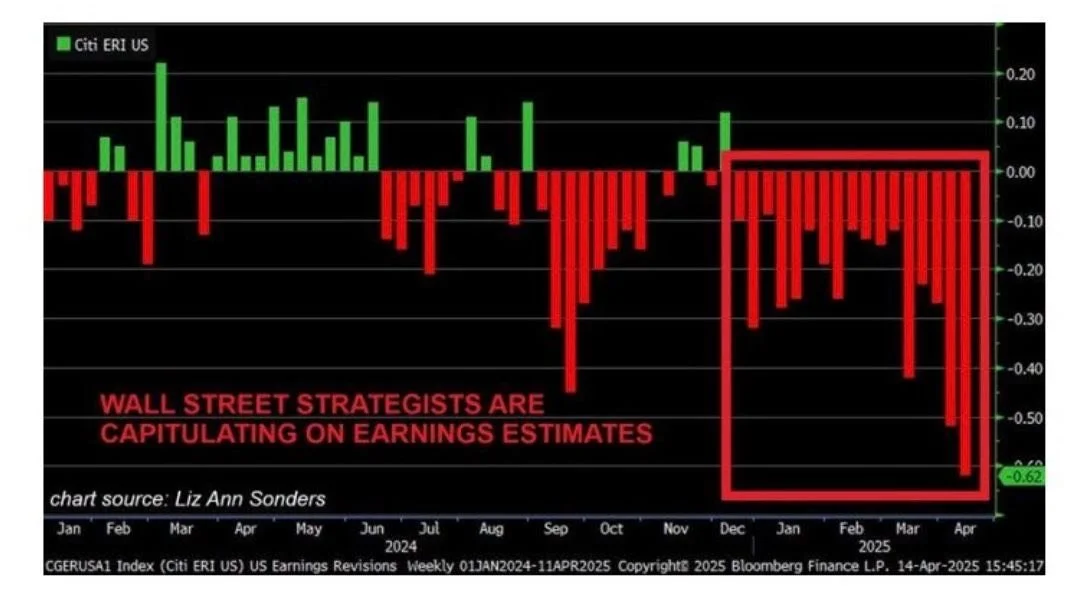
Earnings Estimates
Wall Street strategists are capitulating on earnings estimates
- S&P 500 earnings have been revised down for 17 seventeen consecutive weeks, the longest streak since 2022 Bear Market
- The share of firms with lower EPS revisions hit 48%, the highest since 2020 crisis
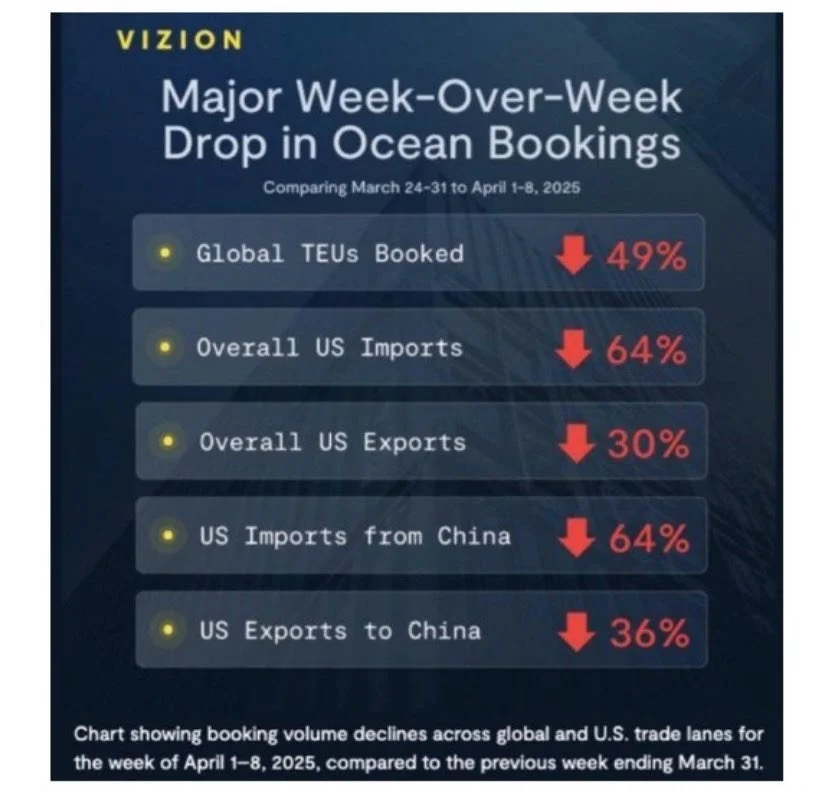
The U.S. Economy & Trade Data
Last week’s trade date paint an incredibly weak picture of the economy
- 49% drop in global container bookings
- 64% drop in U.S. imports
- 34% drop in U.S. exports
Sentiment or just a start of a trend?
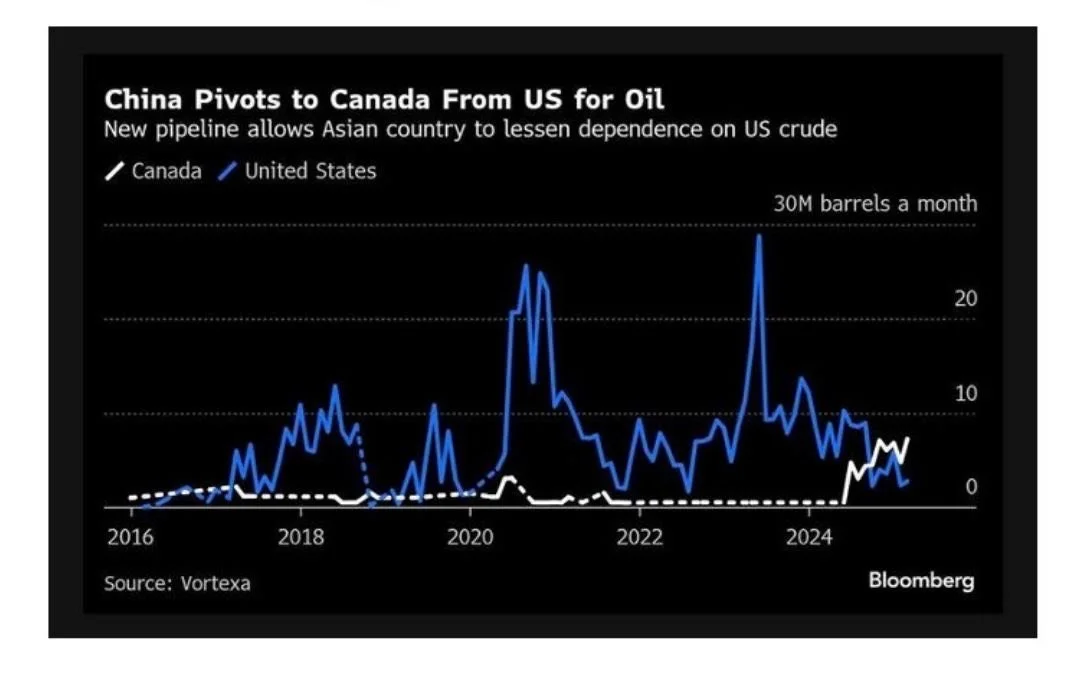
Impact on China’s Oil Purchase
China’s purchases of American oil are down 95% Y-Y, China’s purchaser of Canadian oil are up 700% Y-Y. That’s a $20bn annual loss for the U.S. at $60 oil.
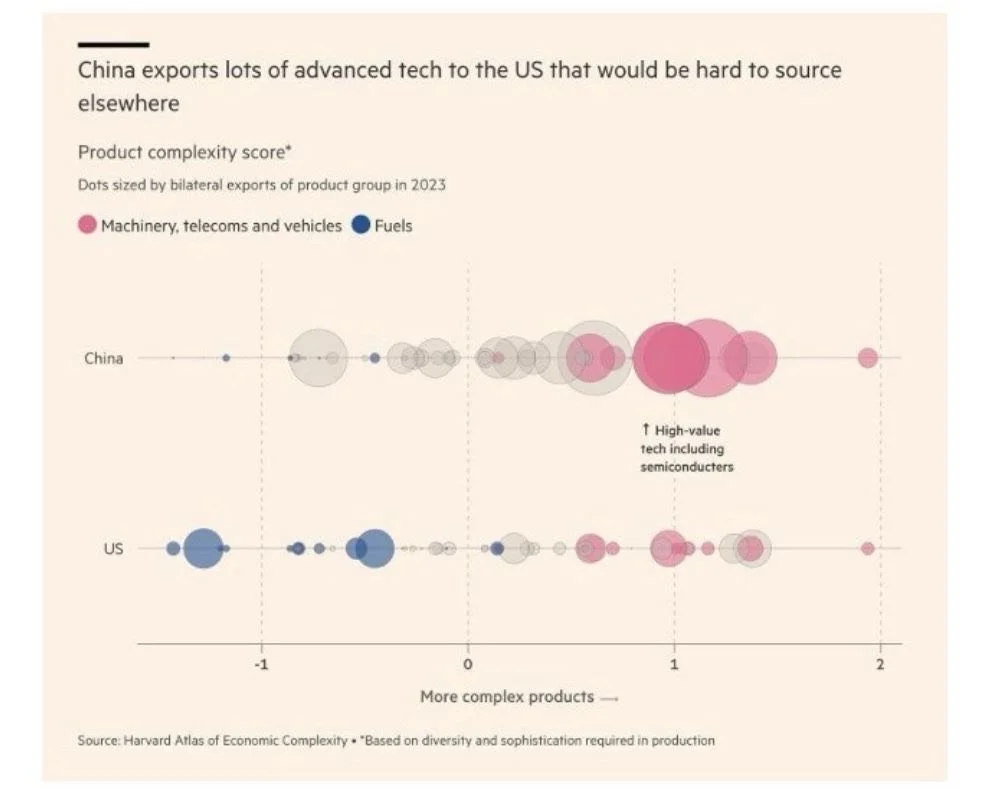
China’s Leverage in the Trade War vs the U.S.
China can replace its imports from the U.S. more easily than the other way around. China exports high-tech to the U.S., while the U.S. exports low-tech & agricultural products to China. Furthermore, China has suspended exports of certain rare minerals and magnets to the U.S.
Impact on China’s Oil Purchase
China’s purchases of American oil are down 95% Y-Y, China’s purchaser of Canadian oil are up 700% Y-Y. That’s a $20bn annual loss for the U.S. at $60 oil.
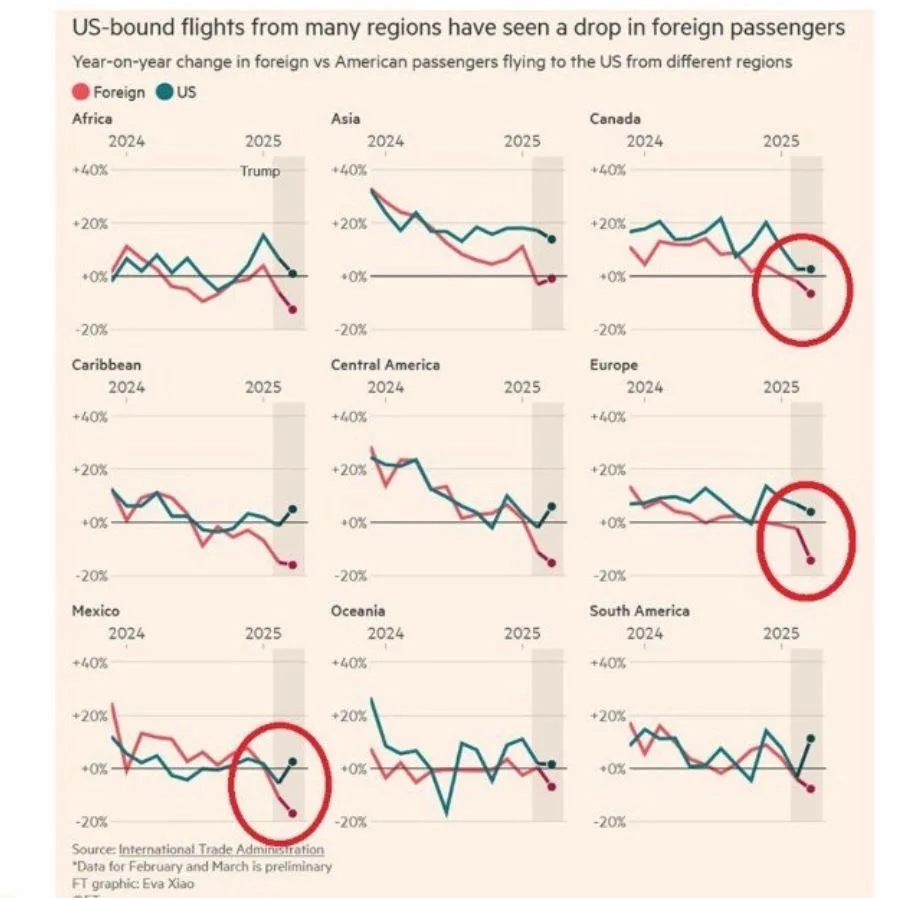
Cancelations of Flights to the U.S.
Europeans flying to the U.S. dropped 18% Y-Y. Bookings from European visitors this summer fell 25% Y-Y
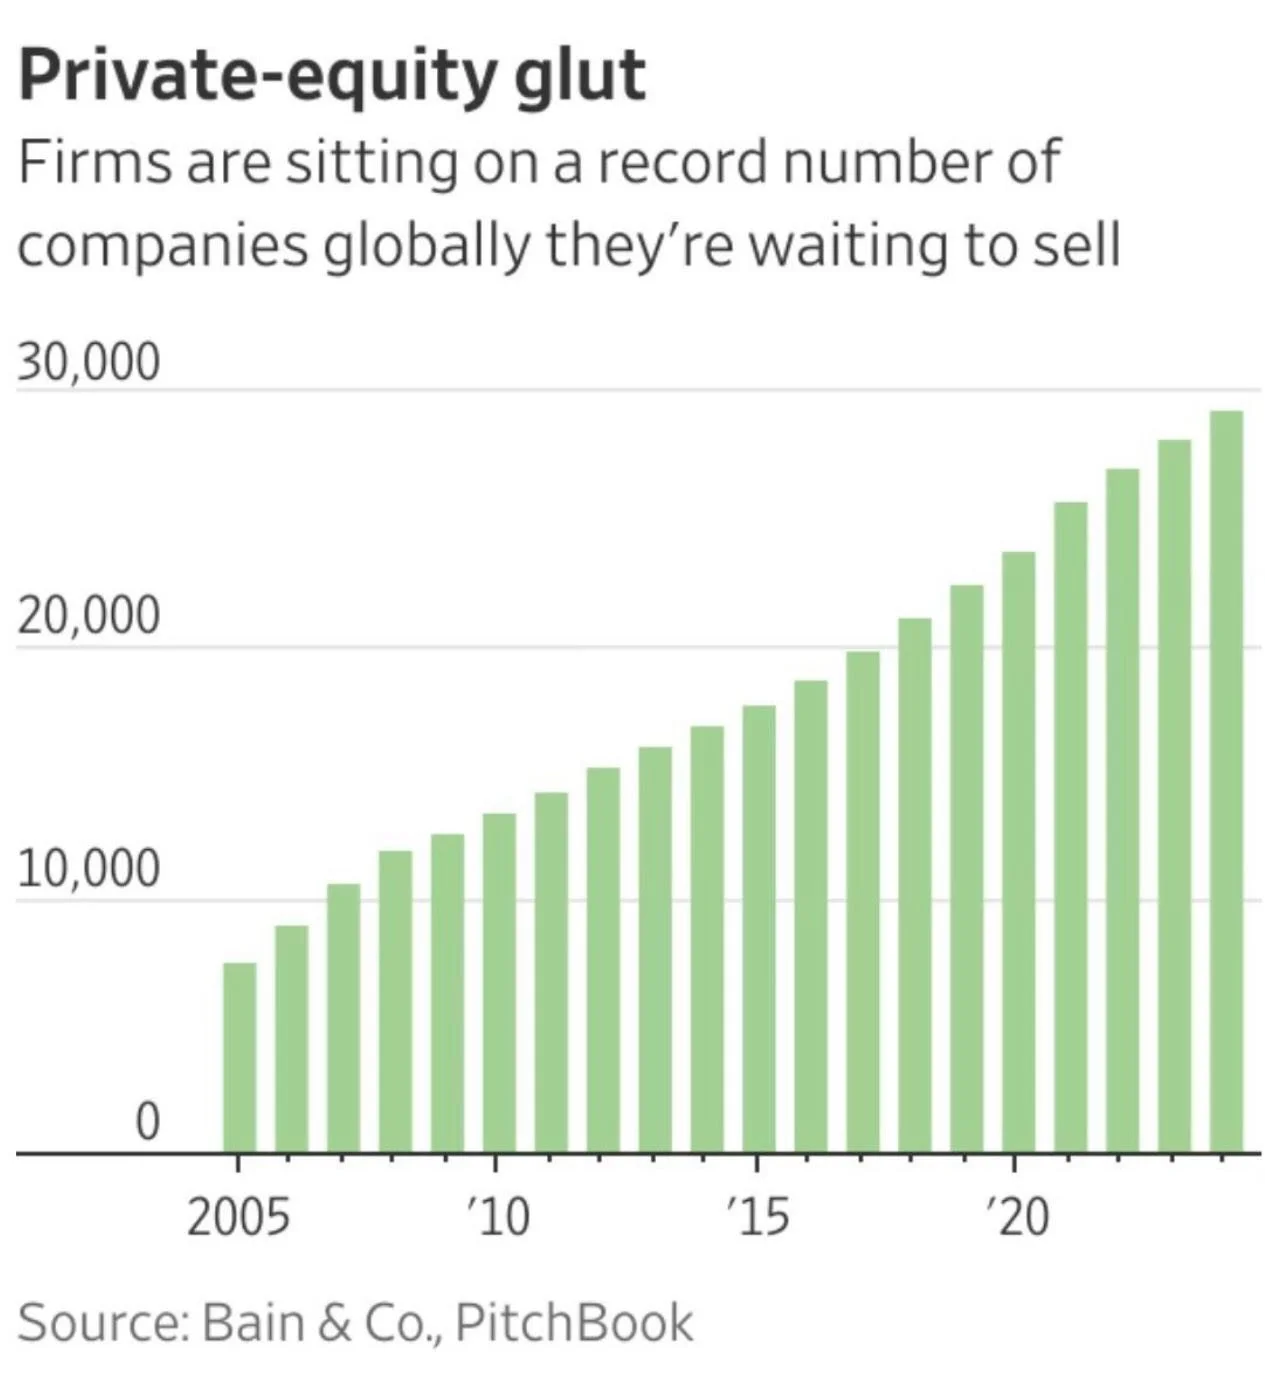
P/E are Waiting to Sell
Private equity is holding off on exits. According to Moody’s, the ratio of available capital—or “dry powder”—to the value of unsold portfolio companies has dropped to a record low.
Market Recap 04/7/25
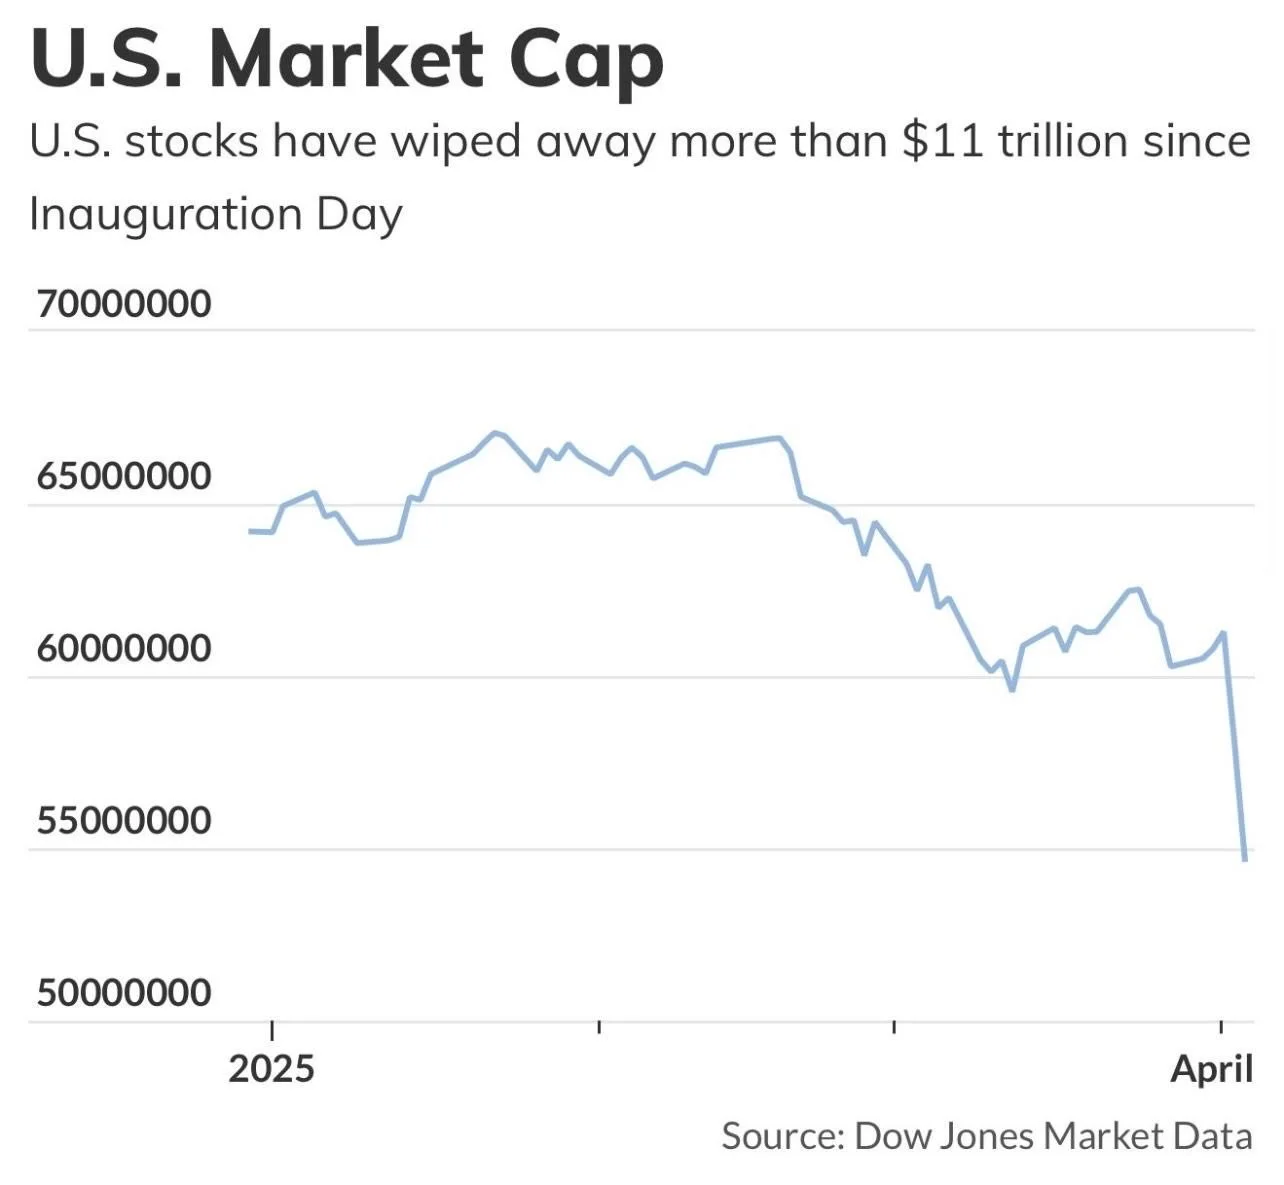
Following an aggressive tariff announcement on Wednesday—and subsequent retaliatory tariffs from China on Thursday—a sharp selloff in equities ensued. Over the span of two days, more than $5.4 trillion was erased from the U.S. stock market, bringing total losses since Inauguration Day to $11 trillion. Notably, the Mag 7 lost $1.8 trillion in market cap during this period.
Both Thursday and Friday saw weak market closes characterized by late selloffs without any supportive buying. While gold and treasuries rallied amid these conditions, oil and the US dollar declined as fears of an economic slowdown intensified. JPMorgan even revised its 2025 recession odds upward from 40% to 60% in response to the new tariff policy.
In reaction to the market turmoil, Treasury yields fell sharply—from 4.80% in January to a low of 3.88% before stabilizing at 4.00%. This drop in yields is expected to benefit borrowers by reducing refinancing costs and easing federal interest burdens where refinancing occurs. Meanwhile, oil prices dropped 7% on Friday alone, settling at $62 per barrel, driven by recession concerns and OPEC’s production hikes.
It appears as the current administration wants to “squeeze the market”: push yields lower to refinance the debt cheaply, even at the cost of market stress or volatility. But will sovereign investors, especially foreign holders of US debt like China, go along with this?
All in all, a week to remember in market history:
• Global stocks experienced their worst week since the March 2020 COVID lockdown collapse.
• U.S. stocks also recorded their worst week since the March 2020 crisis.
• The NASDAQ, alongside the Russell 2000, entered bear market territory—over 20% down from their recent peaks.
• Friday set a new record for trading volume across all U.S. exchanges.
• The VIX registered its biggest weekly increase since February 2020.
• U.S. credit markets had their worst week since the COVID lockdown, even more severe than the downturn during the SVB banking crisis.
• Bitcoin touched $77,000 on Sunday evening.
• Copper prices fell on Friday by the largest margin since the Lehman collapse in October 2008.
• Mag7 stocks shed $1.4 trillion in market cap over the week—the largest weekly loss on record.
You can also read our past market insights here.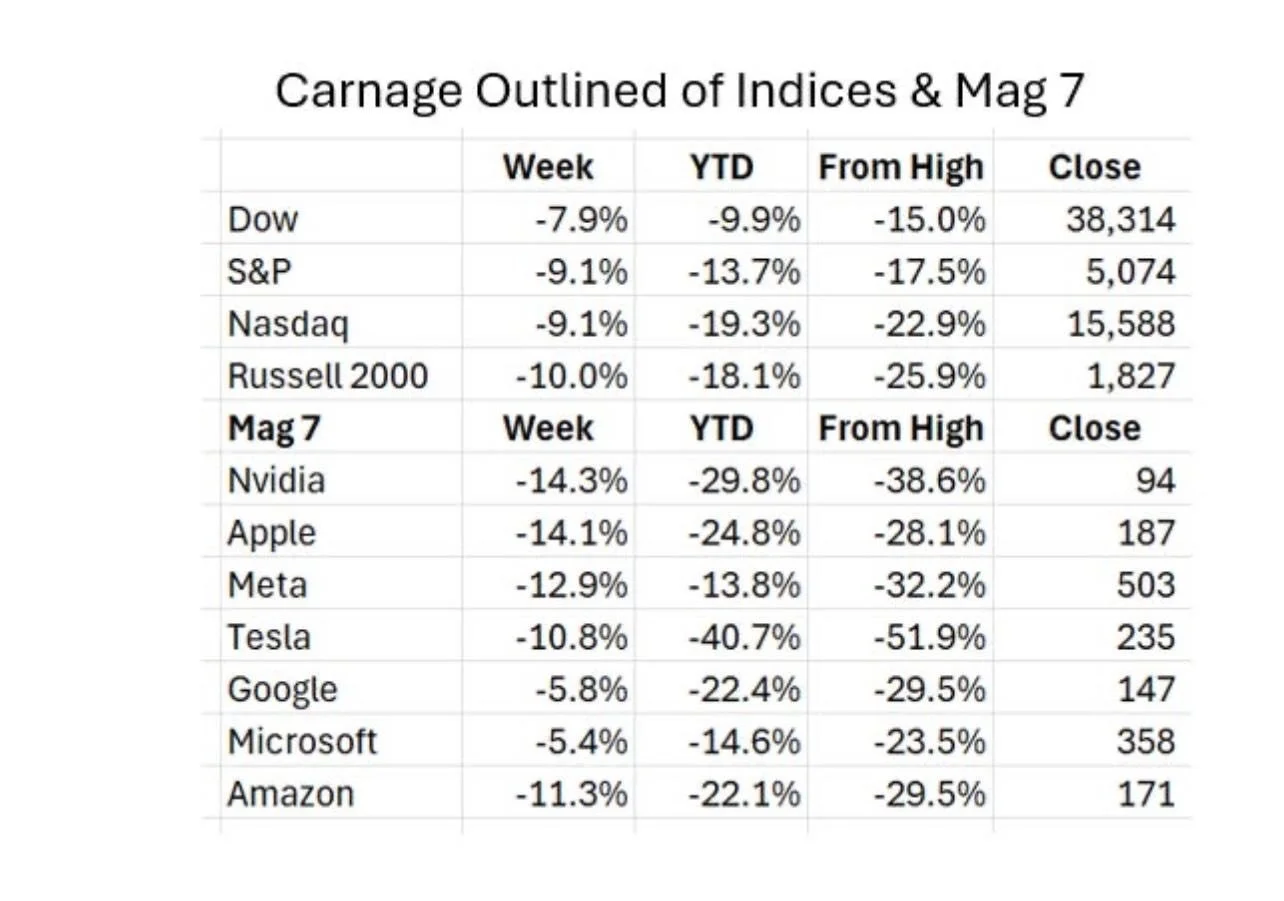
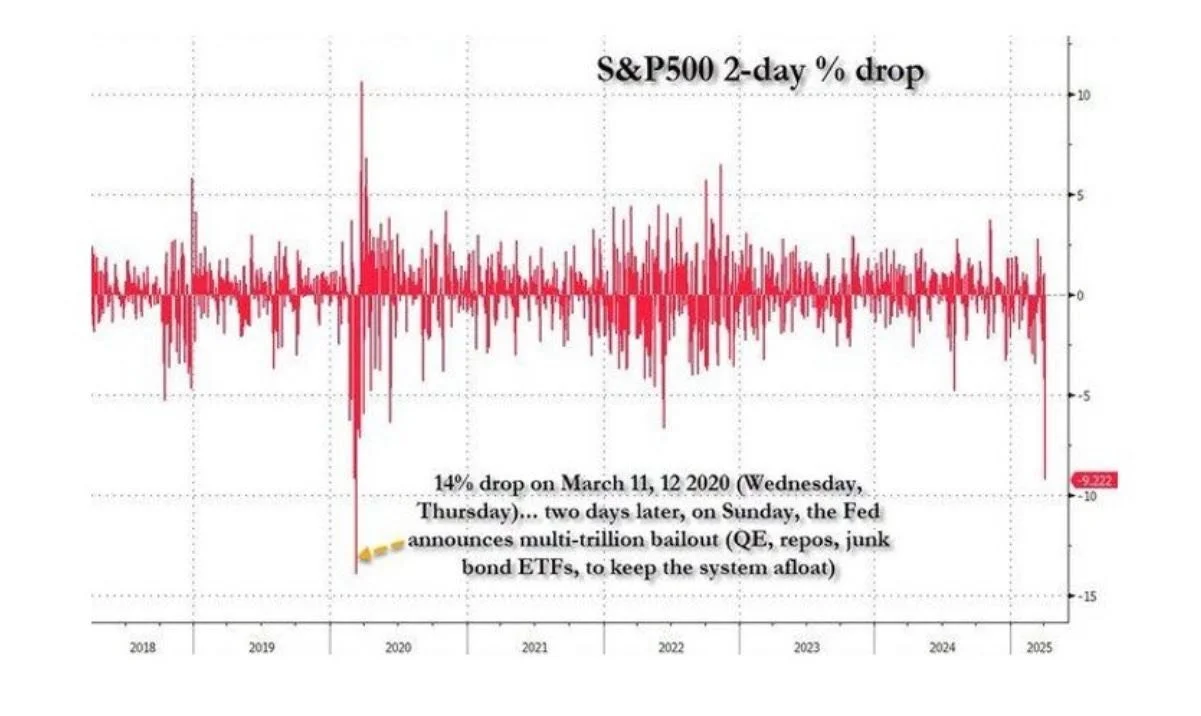
will the Fed start printing again?
When the market previously fell 10% in just two days, the Fed intervened with a massive bailout that included $500 billion in QE, $1 trillion in daily repo operations, and tens of billions in junk bond ETF purchases.
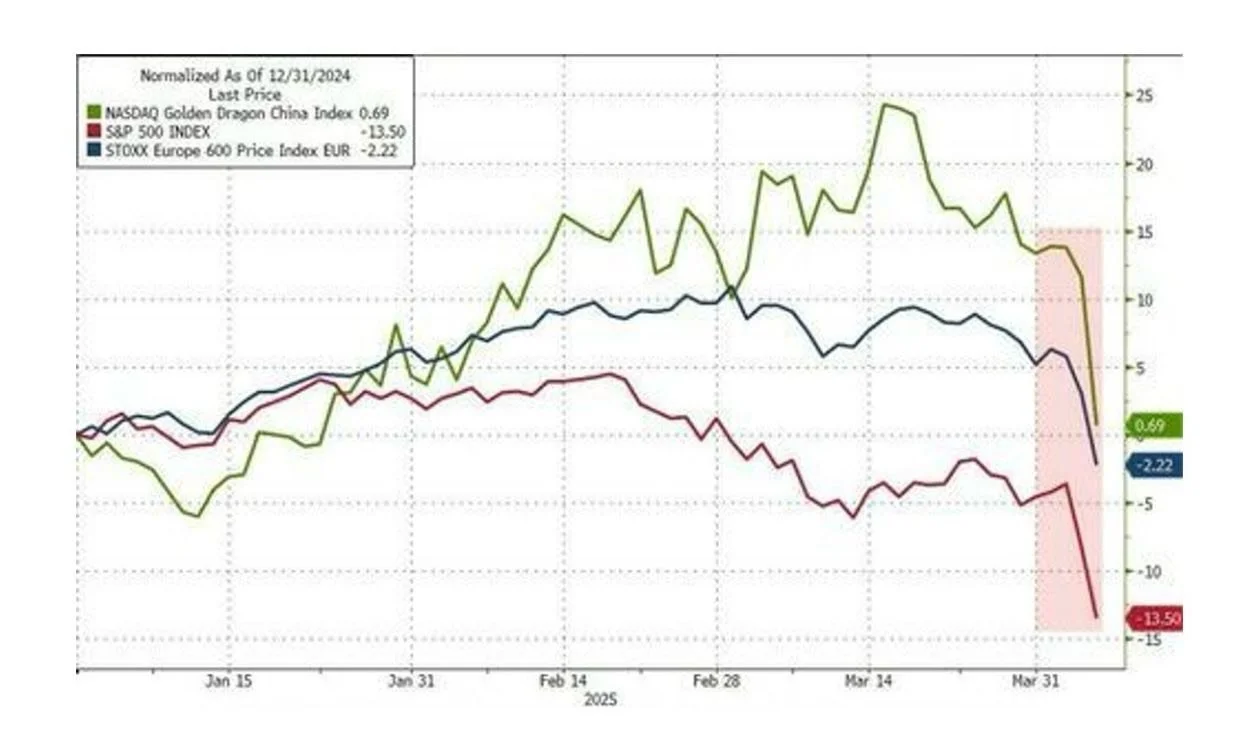
CHINA, EU, US EQUITIES
Year-to-date, China’s equities are still leading, Europe has turned red, and the US market is in a severe downturn.
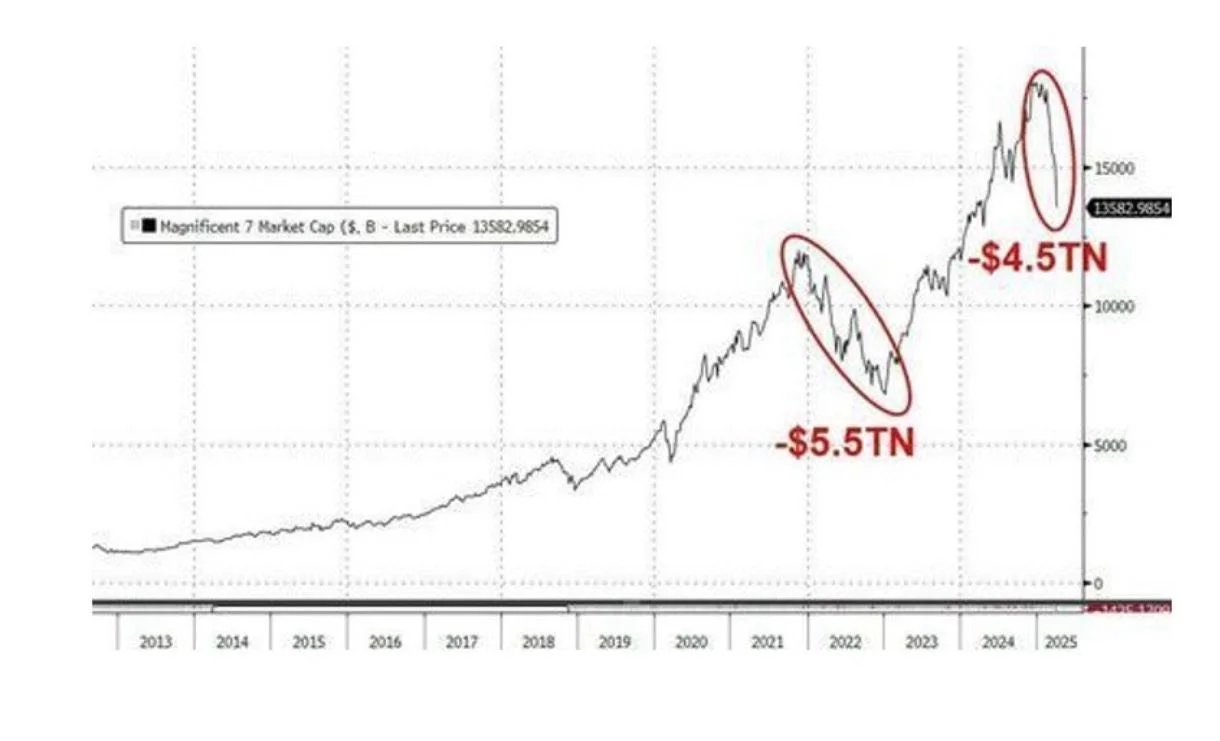
MAg 7 Stocks
The Mag 7 shed $1.4 trillion in market cap this week—the biggest weekly loss on record—and are now down $4.5 trillion from their January peaks.
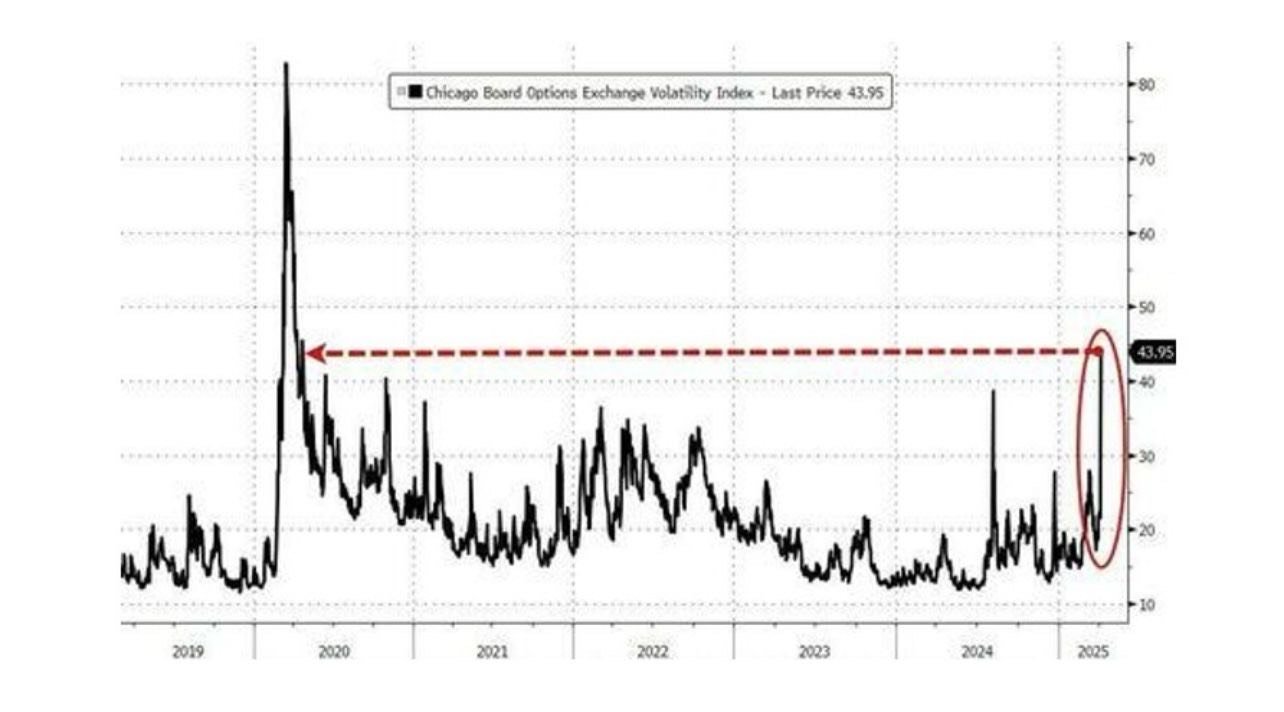
The Vix Exploded
The VIX spiked dramatically this week, recording its largest weekly jump in absolute volatility since the 2020 COVID collapse, closing at its highest level since then.
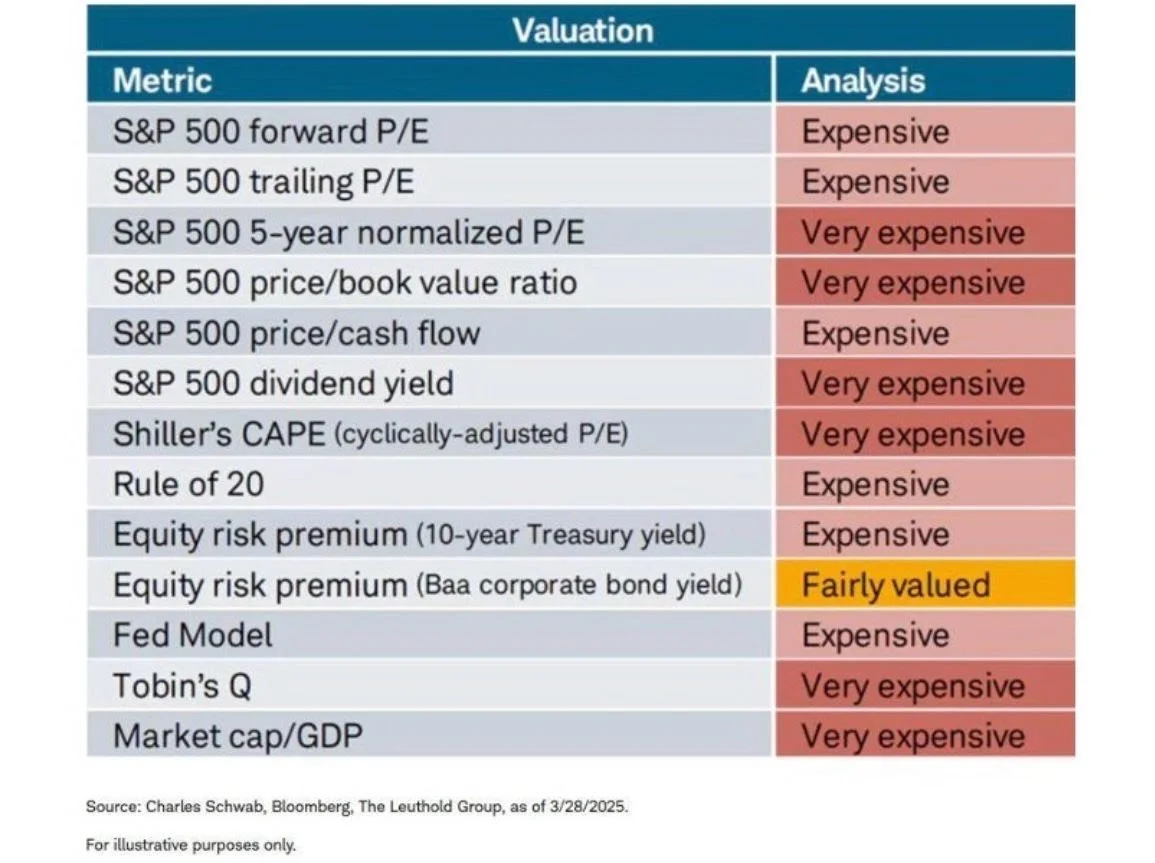
IS THE S&P INDEX STILL EXPENSIVE?
Despite the recent pullback, the S&P remains overvalued. According to Charles Schwab’s analysis, the US stock market is considered expensive or very expensive on 12 out of 13 valuation indicators. Metrics such as the 5-year normalized P/E, P/B, and Schiller CAPE remain historically elevated despite the selloff.
WHAT the REAL YIELD TELLs US?
If real yields are right, this is far from over.
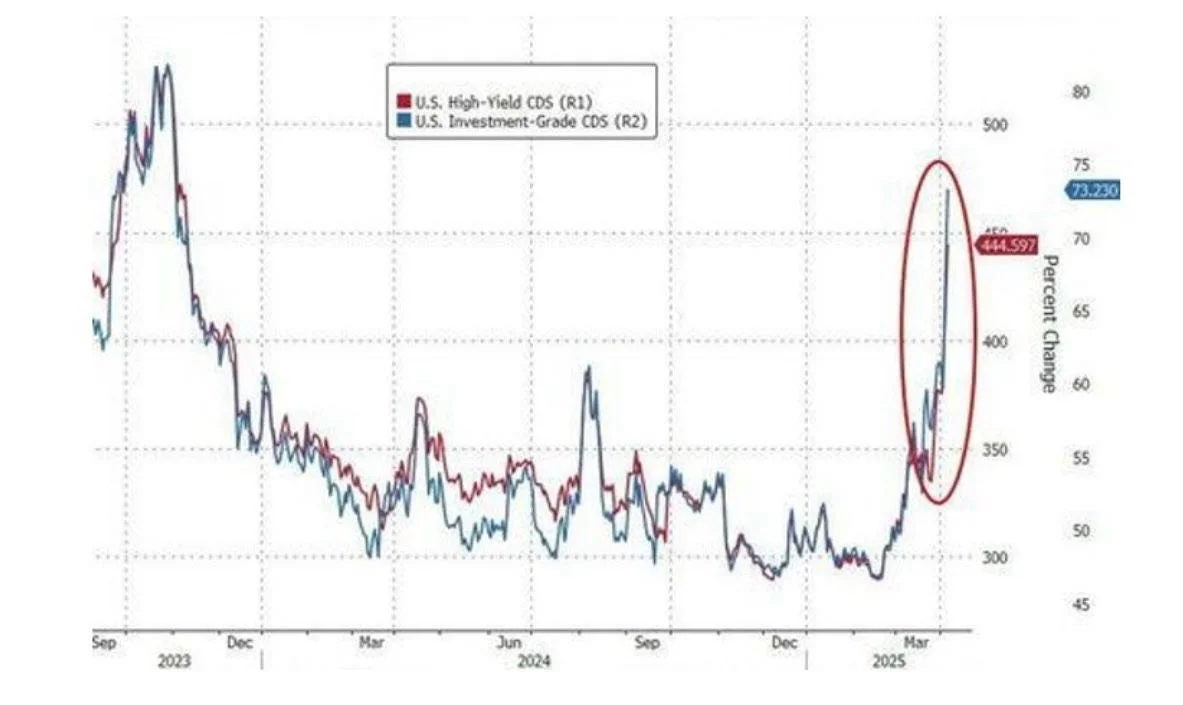
High Yield Credit
High yield credit spreads widened by over 70 basis points this week, marking a worse performance than the worst week of the SVB banking crisis in March 2023, and the worst for credit since April 2020.
US Tariffs
This chart displays the announced reciprocal tariffs from some of the US’s largest trading partners. In particular, China’s tariffs include a 20% rate imposed earlier this year in addition to a 34% reciprocal tariff.
Two formidable challenges
Two formidable challenges lie ahead:
(1) US Treasury Refinancing and (2) Global Corporate Debt.
(1) US Treasury Refinancing
Historical patterns indicate that 2025 will be a crucial year for US Treasury refinancing, with enormous amounts due—especially in May and June. Here are the estimated key refinancing dates:
• May: Approximately $300–500 billion (likely the peak)
• June: Approximately $300–500 billion (likely the peak)
• August: Approximately $200–400 billion
• November: Approximately $200–300 billion
(2) Global corporate debt market
Over the past decade, trillions of dollars have been invested in private equity and private credit. This flood of capital has concentrated in too few robust opportunities, and there has been very little oversight or transparency. Consequently, hundreds—if not thousands—of small to mid-cap, highly leveraged companies have quickly shifted from profitability to losses.
This situation is reminiscent of the pre-2007 era, when many believed home prices would never fall. Today, a similar structural issue exists: the assumption that all this speculative debt will mature at par, simply because there isn’t price volatility during the life of the loan.
The global corporate debt market stands at about $40 trillion. In this context, a $40 billion downgrade due to distress represents just 0.1% of the entire asset class. It seems fair to say that such an event wouldn’t be considered systemic until losses reach or exceed a 5% wipeout. For perspective, roughly 8% of the $1.3 trillion CDO market defaulted before the system ultimately collapsed.
Market Recap 03/31/25
Stocks Decline Amid Tariffs, Economic Slowdown & Inflation Concerns
U.S. stock indexes fell over the week, weighed down by losses in the IT and communication services sectors, while value stocks outperformed growth stocks for the sixth consecutive week. Market sentiment took a hit following new tariff announcements, including a 25% levy on all non-U.S.-made automobiles, alongside concerns over a broader economic slowdown and weakening consumer confidence.
Inflation worries also intensified as the core PCE price index—the Federal Reserve’s preferred inflation gauge—rose 0.4% in February, up from January’s 0.3%. On an annual basis, core PCE climbed 2.8%, remaining well above the Fed’s 2% target. This data appeared to contribute to Friday’s market decline, pushing stocks to close the week near their lowest levels.
U.S. Treasury yields remained volatile but ended little changed. In global markets, the STOXX Europe 600 Index dropped about 1.4% as fresh U.S. trade tariffs were announced. Japan’s Nikkei 225 fell 1.48%, while Chinese markets remained steady amid a light economic calendar and in-line corporate earnings.
Commodities surged, with gold hitting a record $3,080 on Friday—up over 16% in Q1, marking its best start to a year since 1986. Silver climbed back above $34, and copper reached a new all-time high. Meanwhile, oil prices dipped on recession fears but still posted their third consecutive weekly gain. Bitcoin remained volatile, ending the week near $82K.Investors will be looking forward to a slate of important economic data this week. Notably, the March jobs report will be released at 8:30 a.m. ET on Friday, April 4.
You can also read our past market insights here.
Sharp breakdown below the 200-day moving average for the S&P 500
This is the 3rd largest withdrawal amount on record and in-line with levels seen during March 2020.
Foreign investors withdrew $6bn from U.S. equity funds last week


Hedge fund have cut their exposure to Magnificent Seven to the lowest level in two years.

U.S. Core PCE MoM +0.4%, highest since last July
The alternative model which adjusts for imports and exports of gold, is 0.2%.
On March 26, the GDPNow model nowcast of real GDP growth in Q1 2025 is -1.8%

The Conference Board’s measure of expectation for the next 6 months dropped nearly 10 points to 65.2.
US Consumer Confidence tumbles to its lowest in 12 years


Americans Fall Behind the Car 🚗 Payments
The median household income necessary to purchase the median priced home for sale in the U.S. is ($124k) is now 57% higher than the current median household income ($79k)
This is the most unaffordable housing market in history.

The Fed’s preferred measure of inflation (Core PCE) moved up to 2.8% on February and remains well above 2% target that has yet to be achieved.

In the U.S., mortgages now eat up 40% of household income. This is the highest in over 30 years.

A key trend for the coming years: a significant wage gap has emerged between the U.S. and its global competitors
Most Americans are largely unaware of just how much higher their earnings are compared to workers in Japan, Germany, and the UK.
Current administration wants to bring back manufacturing to the USA, however, wages, unions and healthcare/benefit costs make the US very uncompetitive in making things relative to other countries. It is hard to compete when your wages are 50-100%+ higher than other countries.


Nice visual of how sector move based on where we are in business cycle

ChatGPT remains the leading AI tool, attracting 4.7 billion monthly site visits—far surpassing all other AI platforms.
The Most Popular AI Tools by Monthly Site Visits

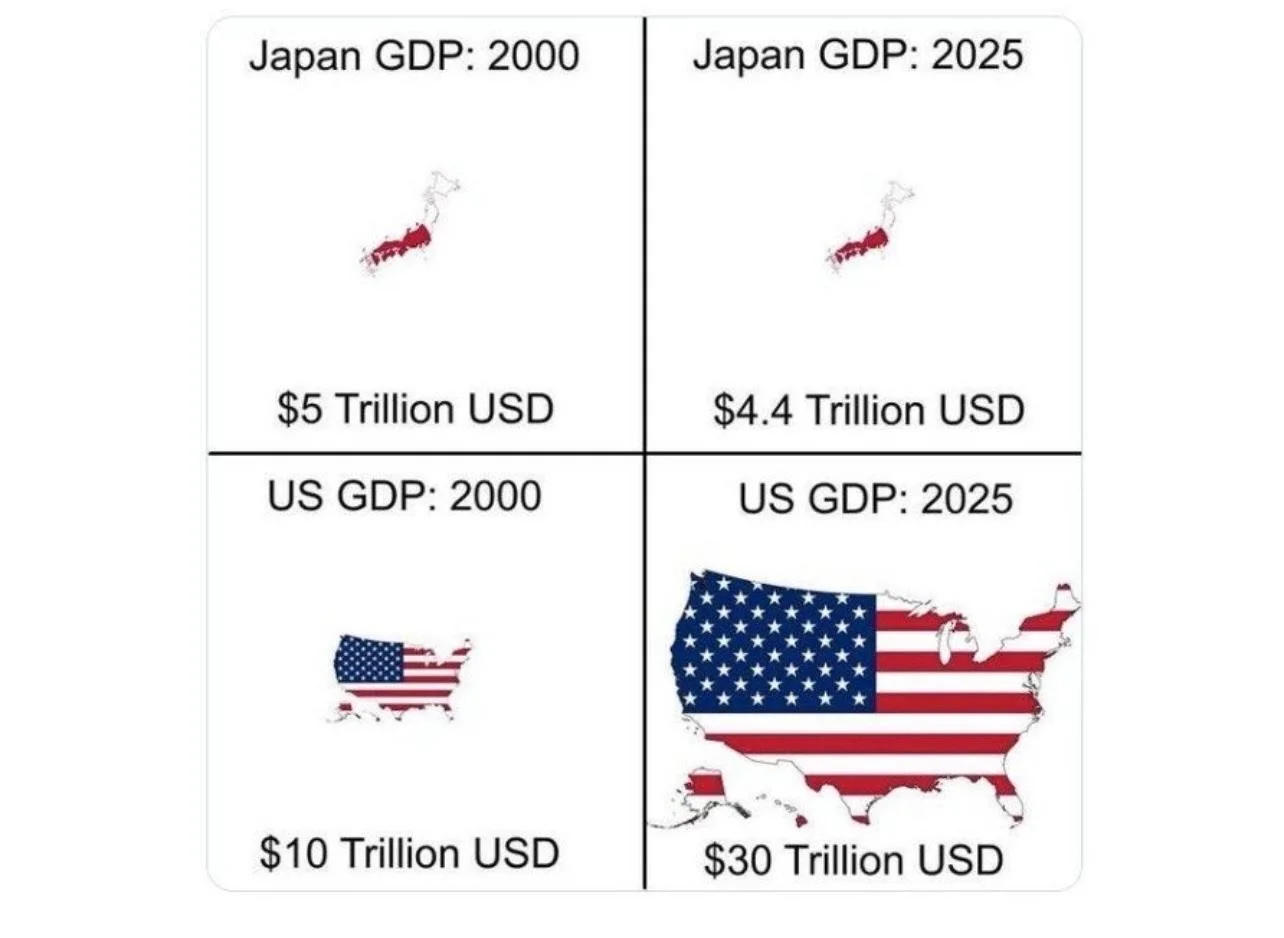
The United States GDP divided in half

Top 22 AI 🤖 Companies: Revenues by Employee
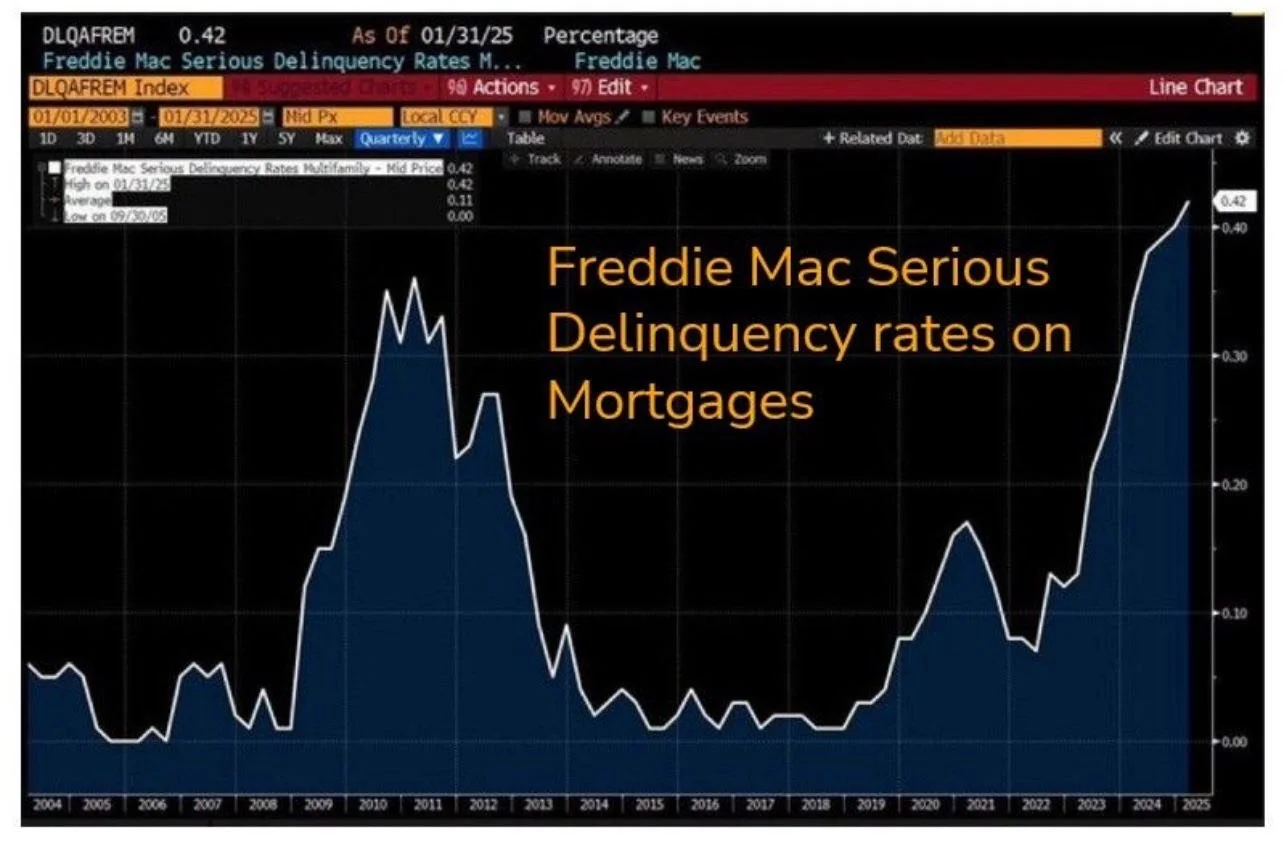
FHA delinquencies just hit 11.03% — the highest in years. What happens when the job market wobbles even a little bit? Thus, why this is a good statistic to include in our recession watch.
6.1 million Americans are behind on their mortgage
Market Recap 03/08/25
Weekly Summary
The past week saw significant declines in major U.S. stock indices, primarily due to escalating trade tensions and growing concerns about stagflation. The S&P 500, Nasdaq, and Russell 2000 each dropped over 3%, while the Dow Jones Industrial Average fell 2.37%, erasing most of its year-to-date gains. These declines were driven by a confluence of geopolitical events and unfavorable technical market conditions.
Trade Policy Uncertainty. The ongoing uncertainty surrounding U.S. trade policy remained a central focus throughout the week. President Trump’s announcement of imminent tariffs on imports from Canada, Mexico, and China intensified investor concerns, leading to significant market volatility.
Economic Indicators:
Manufacturing and Services: Recent macroeconomic data revealed a slowdown in manufacturing growth, while the services sector showed signs of acceleration. The Institute for Supply Management’s manufacturing index dropped to 50.3, indicating tepid expansion, whereas the non-manufacturing index rose, reflecting robust growth in the services sector.
Employment: The U.S. economy added 151,000 jobs in February, slightly below expectations but an improvement over January’s 125,000. The unemployment rate edged up to 4.1% from 4.0%.
Recession Indicators: Concerns about a potential recession are mounting. The probability of a U.S. recession within the next 12 months has risen, with 5-year government bonds pricing in a 52% chance.
European Markets: In Europe, the STOXX Europe 600 Index declined by 0.69%, ending a 10-week streak of gains. Investor sentiment was dampened by uncertainty regarding U.S. trade policy. Germany’s 10-year Bund yield experienced its most significant daily increase since 1990, while the euro strengthened, even as the European Central Bank cut its key deposit rate by 25 basis points to 2.5%.
Asian Markets: Mainland Chinese stock markets advanced after Beijing signaled plans for additional stimulus later this year amid escalating trade tensions with the U.S.
Commodities and Digital Assets: Gold emerged as the week’s best-performing asset, reflecting investors’ flight to safety. Bitcoin remained relatively flat, despite the announcement of the U.S. Strategic Digital Assets Reserves and subsequent meeting.
Overall, the week was marked by heightened volatility across global markets, driven by trade policy developments, mixed economic data, and geopolitical uncertainties.
You can also read our past market insights here.Stocks Endure Worst Week in Six Months; S&P 500 and Nasdaq Rebound to 200-Day Moving Averages
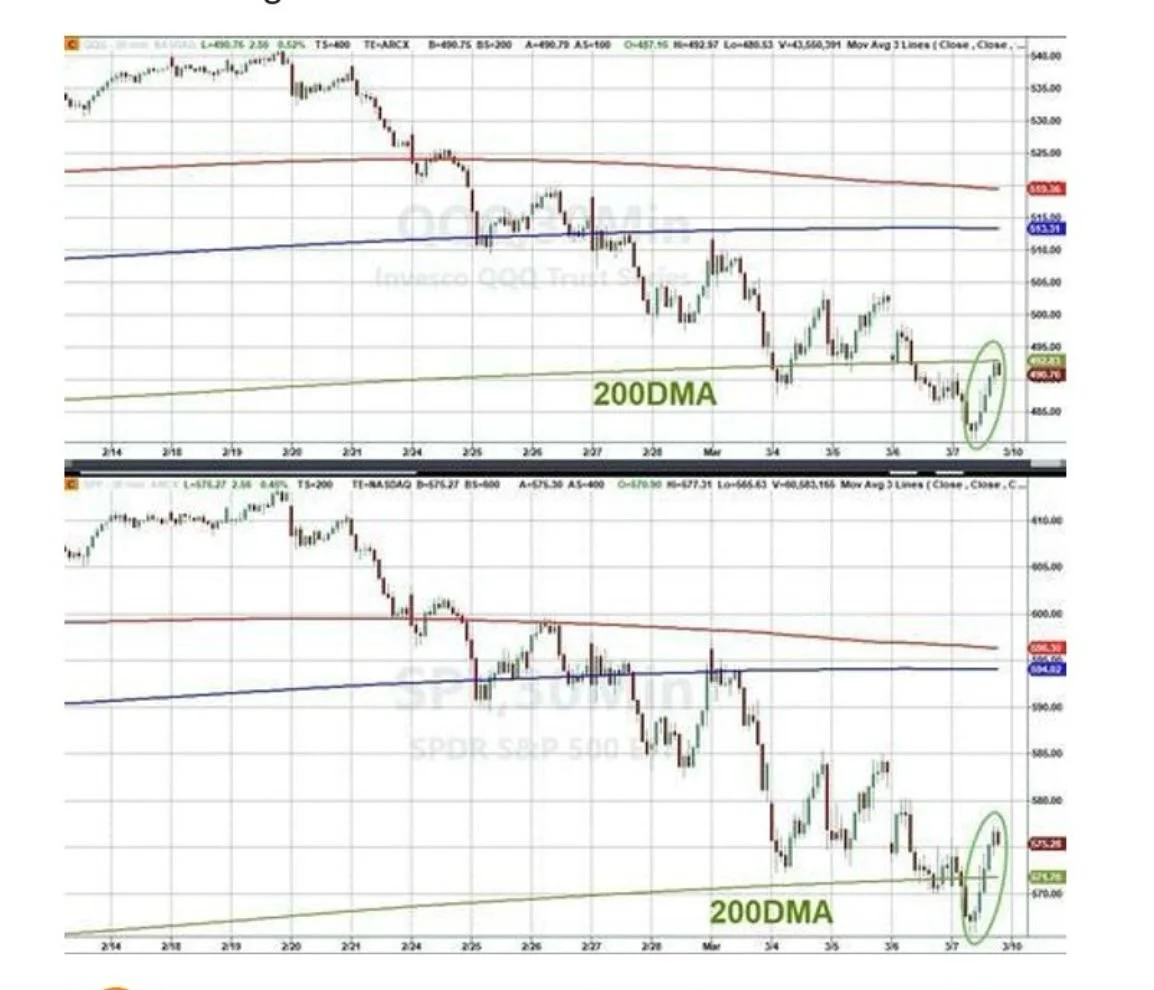
This week, stocks faced their most significant downturn in half a year. However, both the S&P 500 and Nasdaq indices managed to recover to their 200-day moving averages by Friday, after dipping below these critical support levels earlier in the week.
Beryl Insights on Trade Tariffs and their Impacts
Adjustments to trade policies and changes in the size of the government sector often entail significant transition costs. The immediate concern for markets is assessing the extent of short-term challenges these adjustments may introduce.
Trade Policy Impacts. The effect of the newly imposed 25% tariffs on imports from Canada and Mexico largely hinges on their duration. A brief imposition may result in minimal economic disruption. However, prolonged enforcement could lead to more pronounced negative consequences, particularly for sectors like the automotive industry.
Market Sentiment: Investor confidence is notably sensitive to policy uncertainty. Recent fluctuations in consumer and corporate sentiment indicators suggest that persistent ambiguity in trade policies may prompt both consumers and businesses to delay spending and investment decisions. This hesitancy, coupled with potential layoffs resulting from government efficiency measures, could exert upward pressure on unemployment rates.
Federal Reserve Considerations: From a monetary policy perspective, tariffs can contribute to rising prices, thereby fueling inflation. Such scenarios embody stagflation risks, characterized by higher prices and reduced sales volumes. Should tariffs on Canada and Mexico persist over several months, the Federal Reserve may prioritize addressing increasing unemployment rates, potentially leading to interest rate cuts.
Economic Stability Risks: The most significant downside risk lies in the potential for policy uncertainty to trigger a sudden economic slowdown. In such a scenario, consumers might curtail expenditures on big-ticket items, dining, and travel, while companies could freeze hiring and capital expenditures, collectively dampening economic growth.
In summary, the interplay between trade policies, market sentiment, and monetary responses necessitates careful monitoring to mitigate risks of economic deceleration.
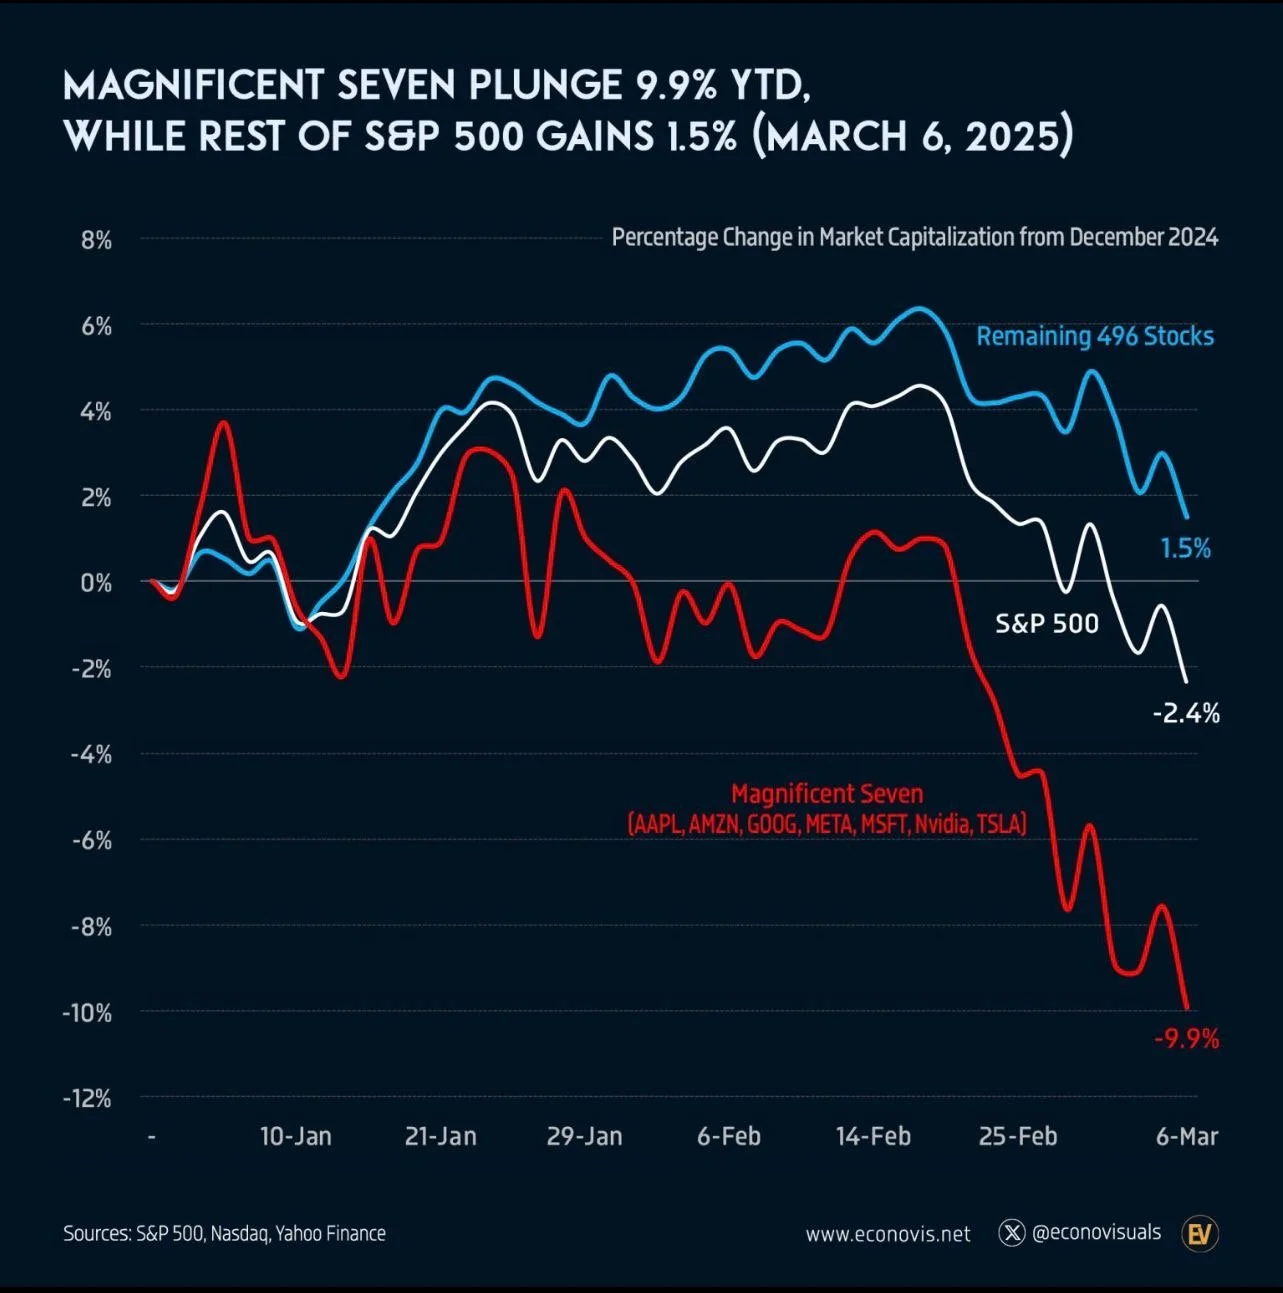
The “Magnificent Seven”—Alphabet, Amazon, Apple, Meta, Microsoft, Nvidia, and Tesla—have collectively experienced a 9.9% decrease in market capitalization year-to-date. In contrast, the other 496 companies in the S&P 500 have seen an average increase of 1.5%, leading to an overall index decline of 2.4%.
‘Magnificent Seven"‘ Decline 9.9% YTD, While Remaining S&P 500 Gains 1.5%
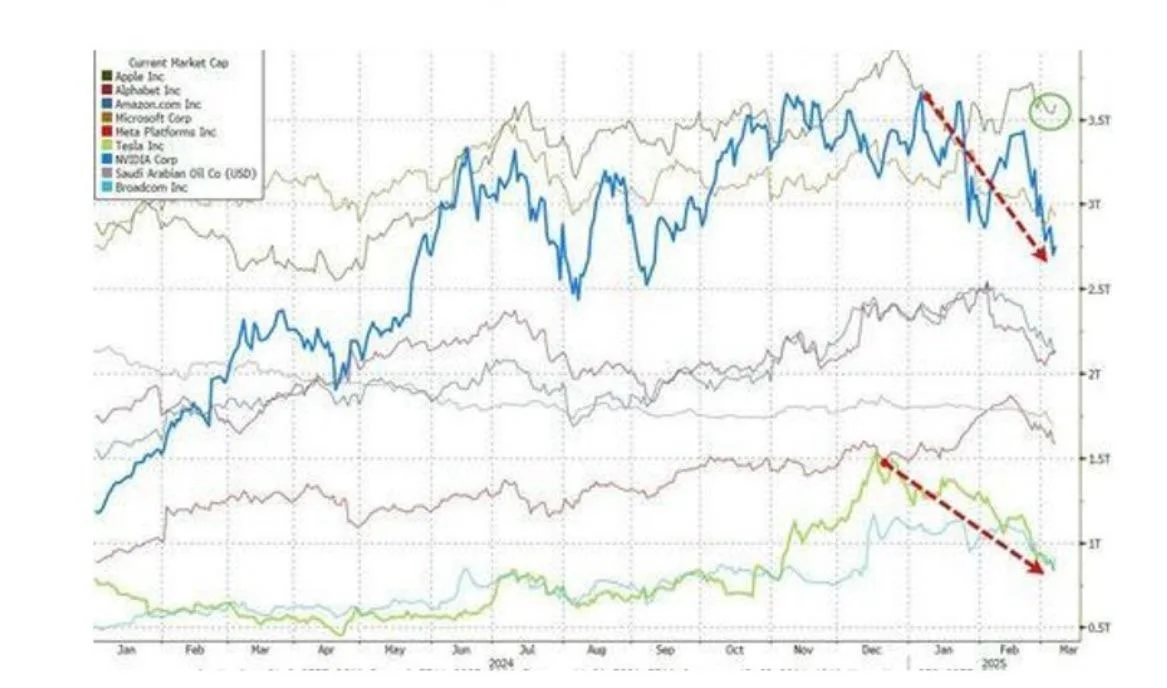
Apple Maintains Market Cap Above $3 Trillion; Nvidia and Tesla Experience Significant Losses
Apple remains the sole company with a market capitalization exceeding $3 trillion. Meanwhile, Nvidia’s market cap has decreased by $1 billion this year, and Tesla has seen a substantial decline of nearly $700 billion.
U.S. Households’ Stock Allocation Reaches Historic High
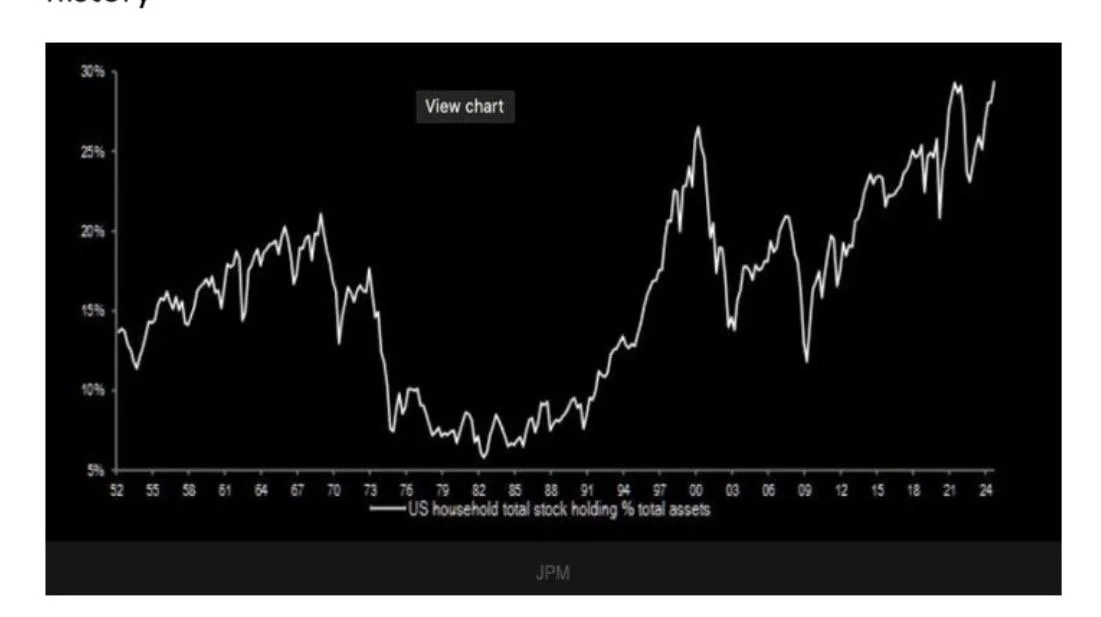
American households now allocate a larger portion of their assets to stocks than ever before, indicating heightened exposure to equity markets.
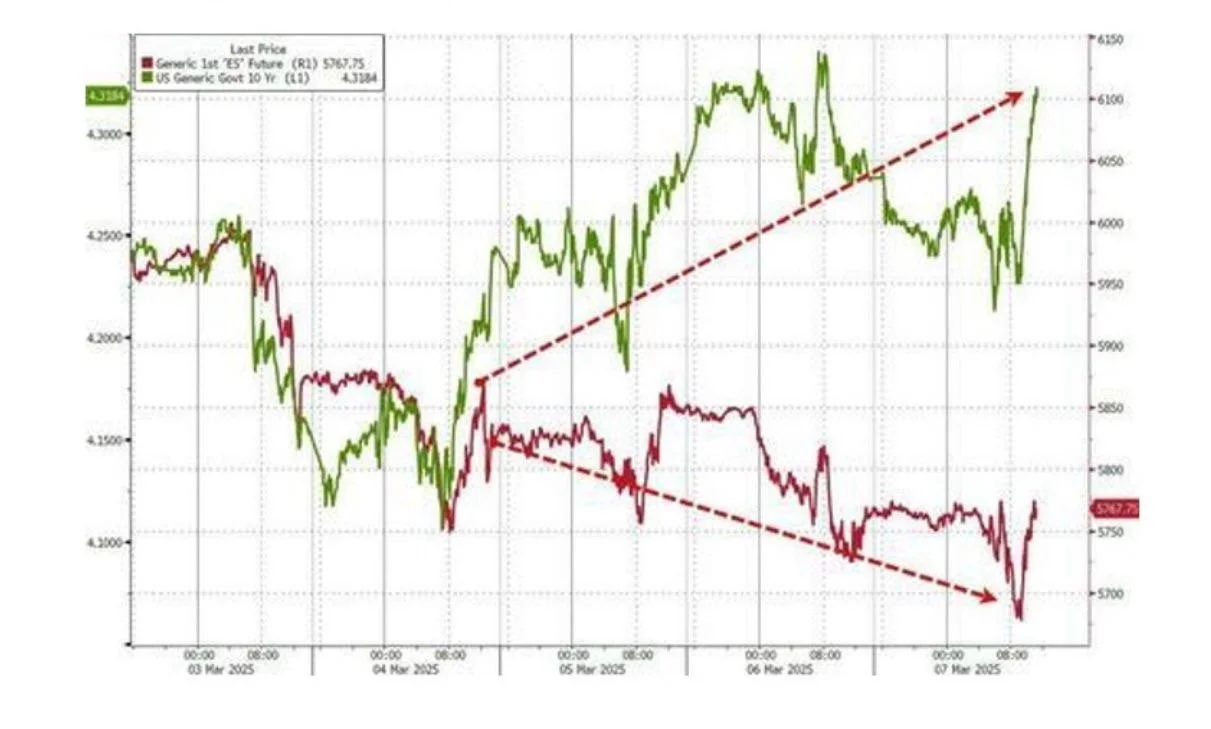
This week, a notable disconnect emerged between the movements of the U.S. 10-year Treasury yields (green) and the S&P 500 index (red), highlighting potential market inefficiencies or differing investor sentiments.
Divergence Between U.S. 10-Year Treasury Yields and S&P 500 Performance
U.S. Rising Concerns Over Imminent U.S. Government Shutdown
Traders are increasingly apprehensive about a potential U.S. government shutdown, which could introduce short-term market volatility.
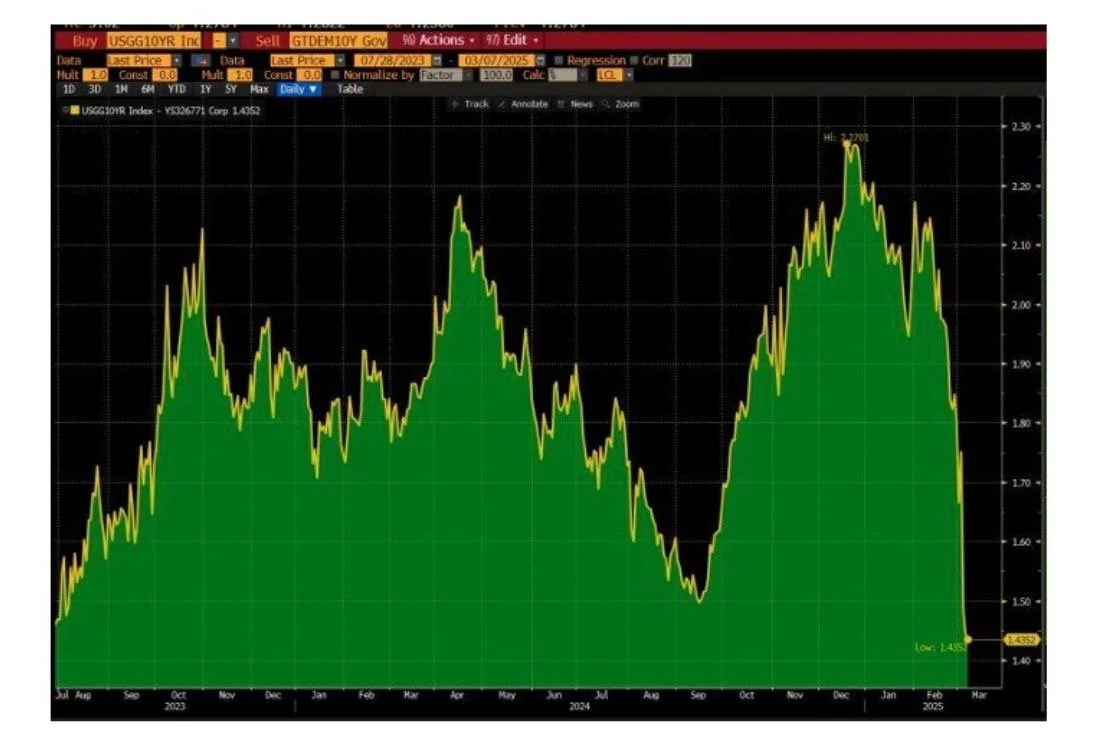
Anticipation of a new government in Germany led to the worst performance of German bonds since 1990, with 10-year yields surging by 30 basis points. The yield gap between U.S. and German 1-year bonds has narrowed to its lowest point since 2023, suggesting that German Bund yields may surpass U.S. Treasury yields by year-end.
German Bonds Experience Worst Day Since 1990 Amid Political Transition
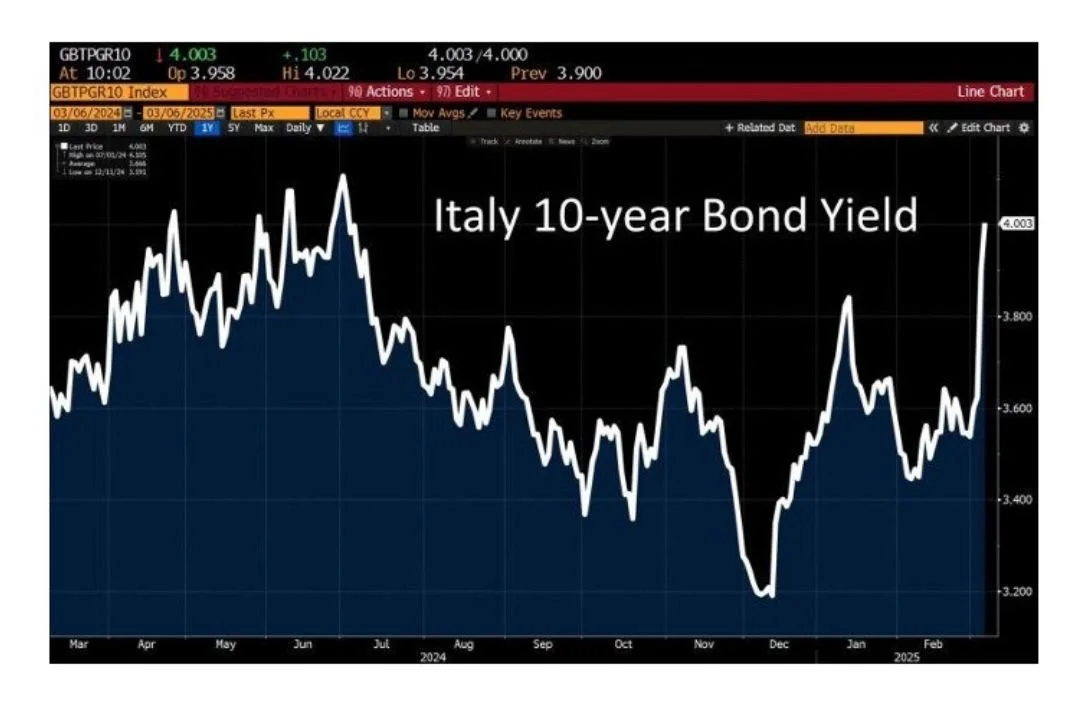
Italy’s Bond Yield Surpasses 4% Amid Germany’s Increased Debt for Defense and U.S. Consumer Economic Data Shows Largest Downside Surprise in Over Two Years
Italy’s bond yield has exceeded 4%, influenced by Germany’s decision to embrace higher debt levels to invest in defense and infrastructure. This situation draws parallels to the 2011-2012 Euro Debt Crisis, during which Italy’s debt-to-GDP ratio was 108%; it now stands at 140%.
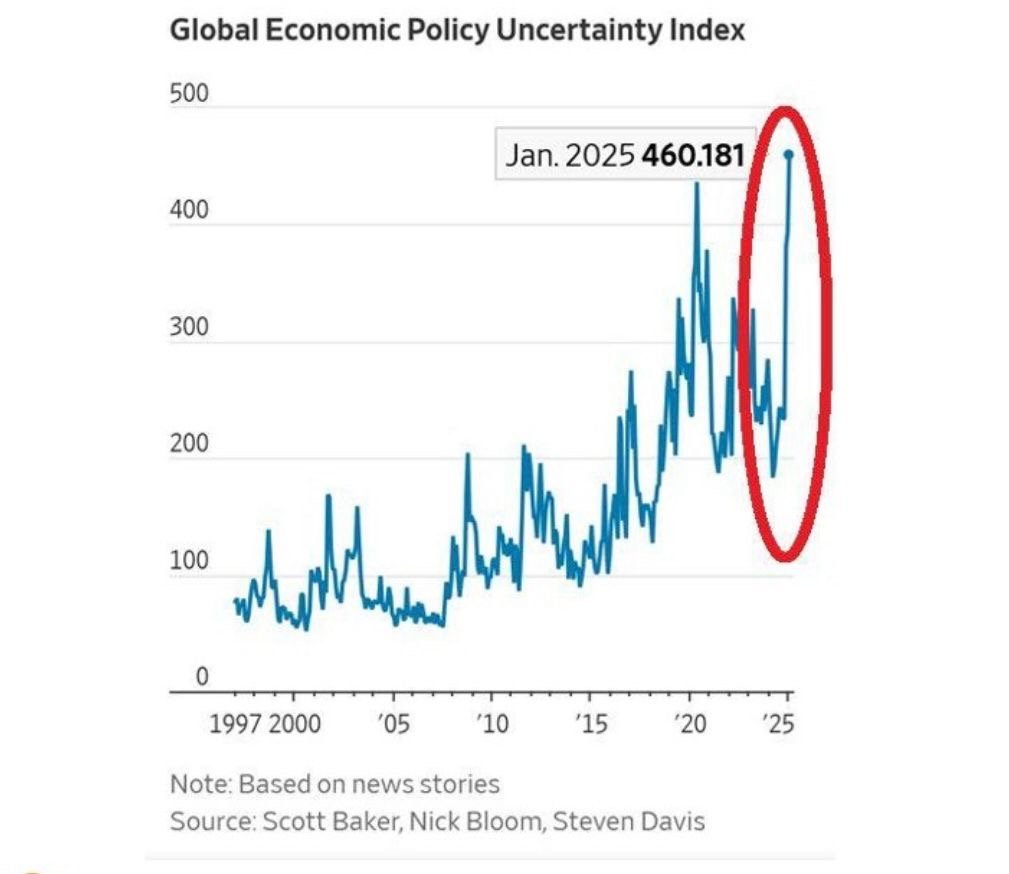
The Global Economic Policy Uncertainty Index has soared to an all-time high, surpassing levels seen during the 2020 crisis. Factors such as U.S. tariffs and a deteriorating global economy are major contributors to investor anxiety.
Global Economic Policy Uncertainty Index Reaches Record High
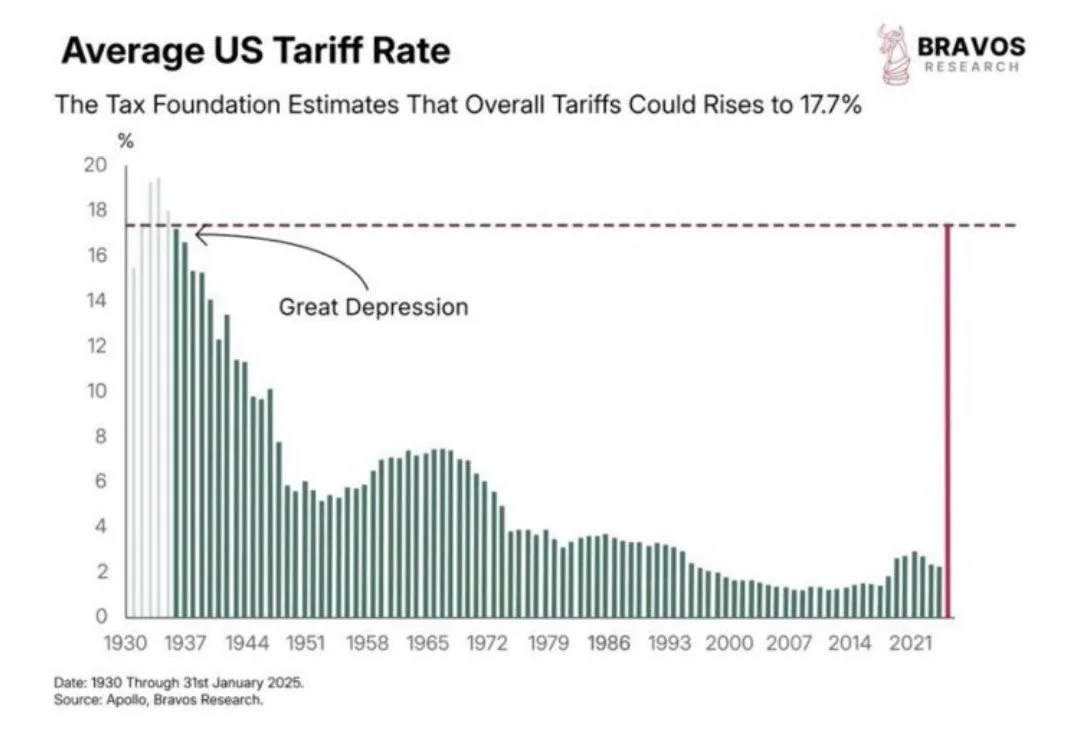
New tariffs have been imposed: 25% on imports from Canada and Mexico, and 10% on Chinese goods. These measures could elevate average tariff levels to 18% under the current administration, the highest since the Great Depression.
Implementation of Tariffs: 25% on Canada and Mexico, 10% on China
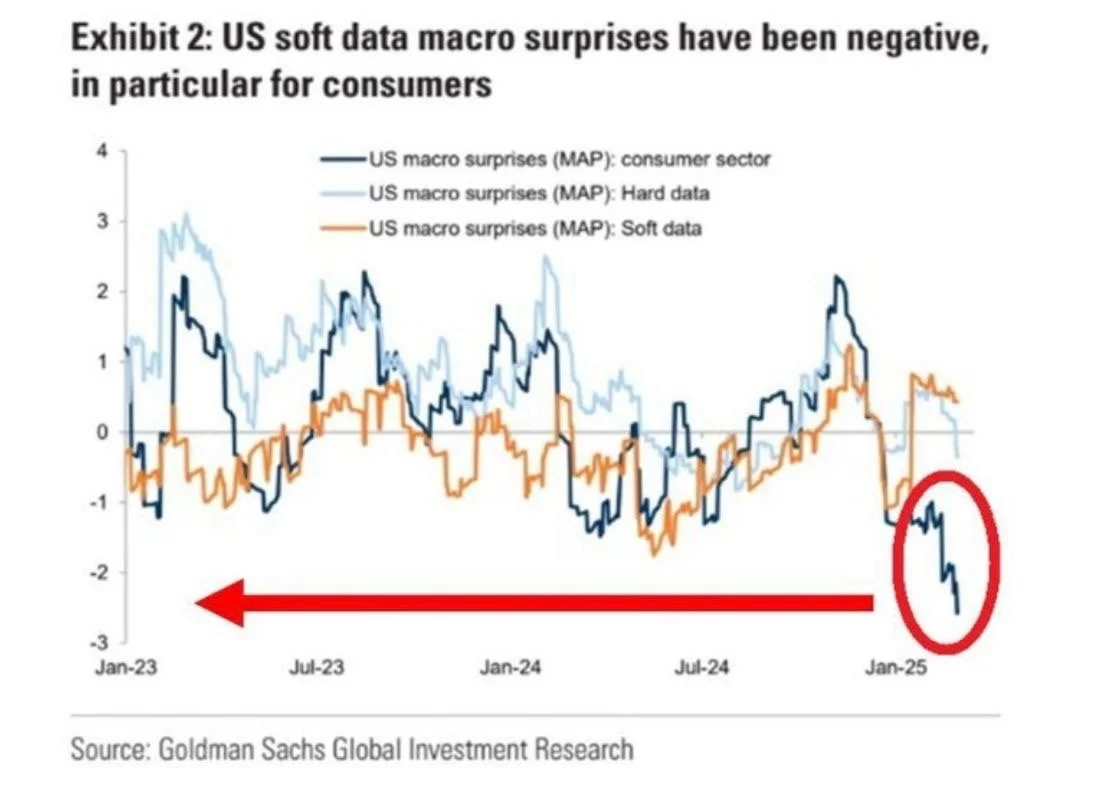
Recent U.S. economic data related to consumer activity has fallen short of expectations by the widest margin in more than two years. Americans have reduced spending due to worsening labor market conditions and persistent high inflation. Given that consumer spending accounts for approximately two-thirds of U.S. GDP, this trend is concerning.
U.S. Consumer Economic Data Shows Largest Downside Surprise in Over Two YearS
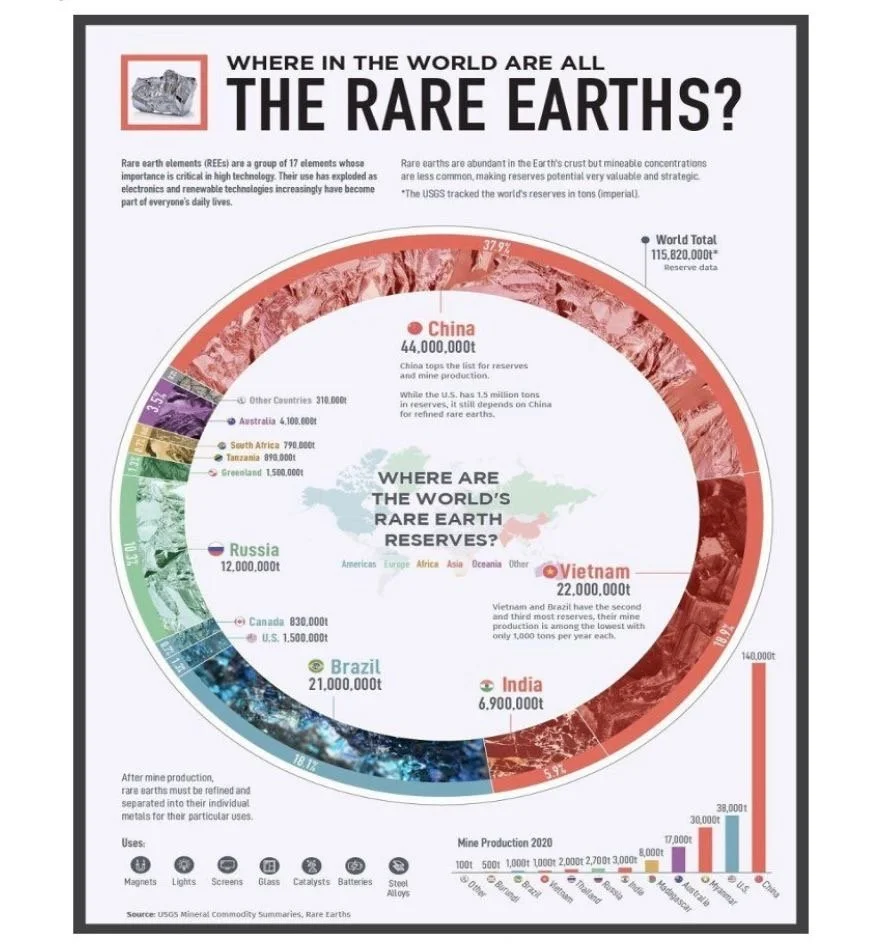
Dependence on Rare Earth Minerals and Concentration of Supply
Modern technologies—such as electric vehicles, smartphones, fighter jets, and renewable energy systems—are heavily reliant on rare earth minerals. Notably, a single country, which is not the U.S., controls 60% of the global supply, underscoring the strategic importance of these resources.
These developments reflect a complex interplay of market dynamics, geopolitical events, and economic indicators that continue to influence global financial stability.
Market Recap 02/22/25
During the week of February 17-21, 2025, major equity indexes experienced declines after the S&P 500 reached record highs earlier in the week. The downturn was influenced by concerns over tariffs, geopolitical tensions, and economic indicators suggesting potential stagflation.
Market Performance:
S&P 500: After achieving record highs on Tuesday and Wednesday, the index retreated sharply in the latter half of the week.
Dow Jones Industrial Average: Experienced its worst day of the year on Friday, dropping over 700 points.
Nasdaq Composite: Also saw significant declines, influenced by broader market concerns.
Key Influences:
Corporate Earnings: Walmart's Q4 earnings report, while surpassing quarterly estimates, provided a cautious outlook for the year ahead. This raised concerns about consumer spending and overall economic health.
Economic Indicators:
Consumer Sentiment: The University of Michigan's Consumer Sentiment Index for February dropped to 64, a nearly 10% decrease from January, reflecting growing concerns over tariffs and inflation.
Inflation Expectations: Year-ahead inflation expectations rose to 4.3%, up from 3.3% in January, indicating heightened consumer concerns about rising prices.
Business Activity: The S&P Global Flash Composite PMI for February fell to a 17-month low of 50.4, suggesting a slowdown in economic activity.
Sector Highlights:
Transportation Stocks: Experienced significant declines, with the Dow Jones Transportation Average falling over 2.6% on Friday, its most substantial daily drop since December 18.
Retail Sector: Walmart's cautious annual outlook contributed to concerns about consumer spending, impacting retail stocks.
Global Markets:
Europe: The STOXX Europe 600 Index ended the week 0.26% higher amid cautious optimism, as investors weighed U.S. trade policy developments and efforts to resolve the Russia-Ukraine conflict.
China: Mainland Chinese stock markets rose, bolstered by strong performances in technology shares following better-than-expected earnings from leading tech companies.
Commodities:
Gold: The precious metal was in demand for the eighth consecutive week as the U.S. dollar fell to two-month lows, reflecting investor interest in safe-haven assets amid market volatility.
In summary, the week was marked by heightened market volatility driven by geopolitical tensions, economic data pointing towards potential stagflation, and cautious corporate outlooks, all contributing to investor unease.
You can also read our past market insights here.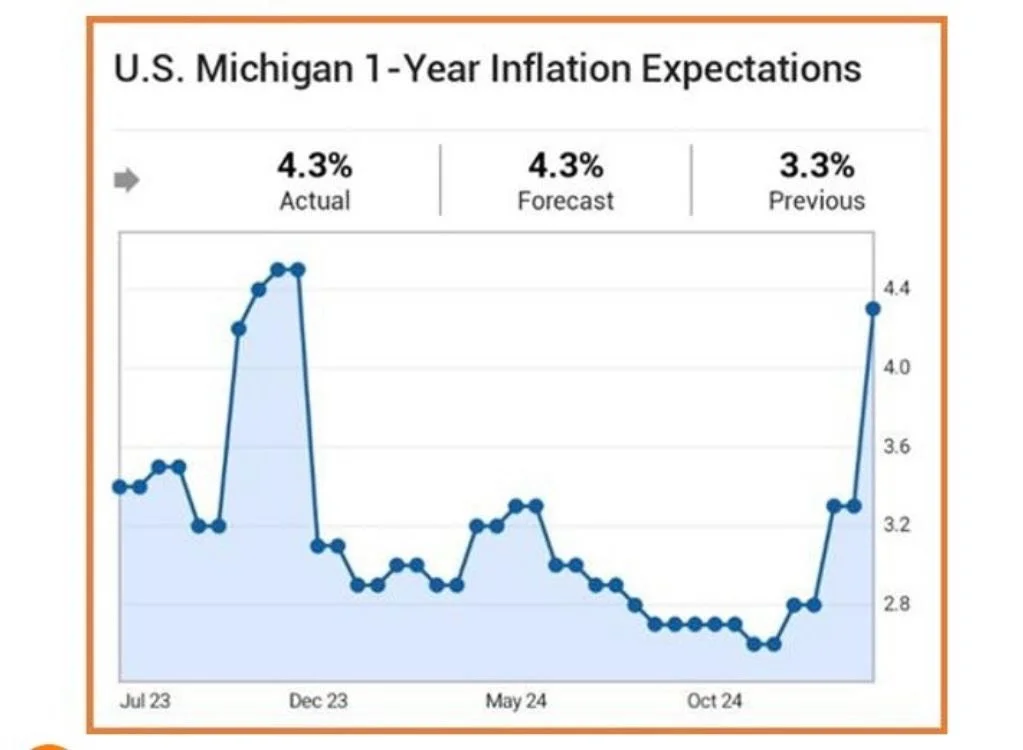
In February, the University of Michigan reported that consumers expect inflation to rise to 4.3% over the next year, a significant increase from 3.3% in January. This marks the highest level since November 2023. The surge is attributed to anticipated price hikes due to tariffs and a tight labor market, potentially exacerbated by recent immigration policies.
U.S. 1-Year Inflation Expectations Surge
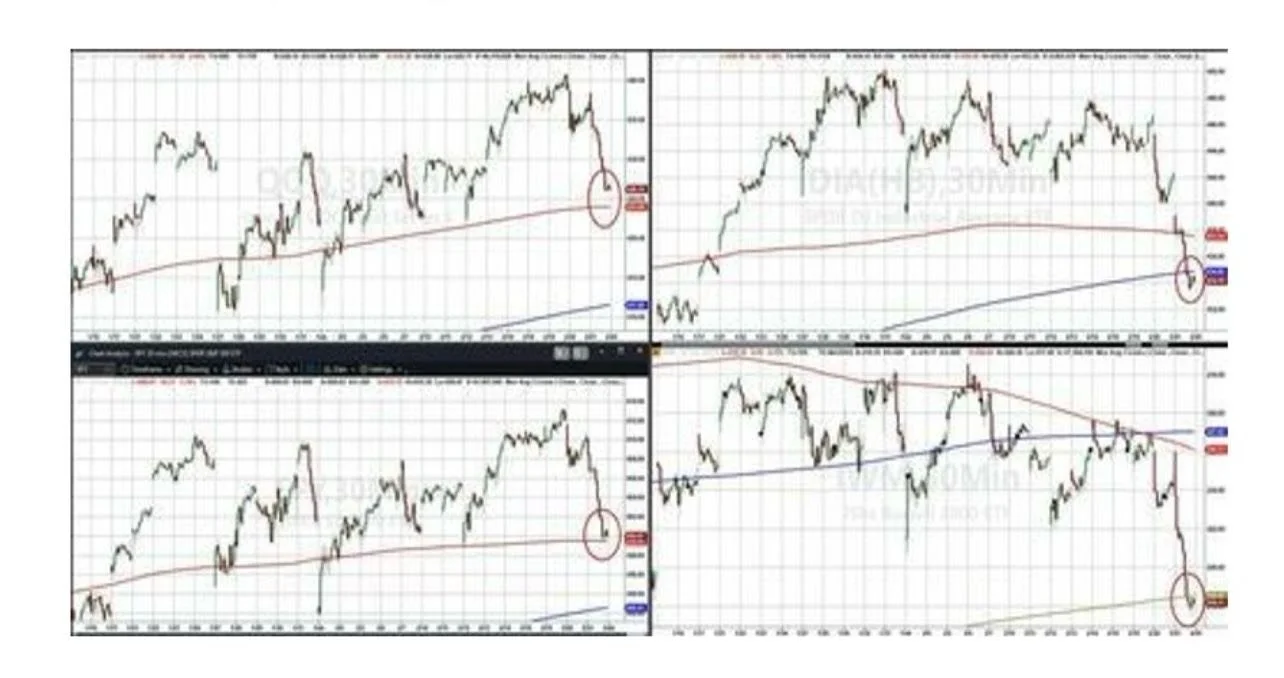
Major U.S. stock indices have reached critical technical thresholds:
Nasdaq and S&P 500: Both have returned to their 50-day moving averages (50DMA).
Dow Jones Industrial Average (DOW): Fallen below its 100-day moving average (100DMA).
Russell 2000: Dropped beneath its 200-day moving average (200DMA).
These movements suggest potential shifts in market momentum.
U.S. Equities & Technical Indicators
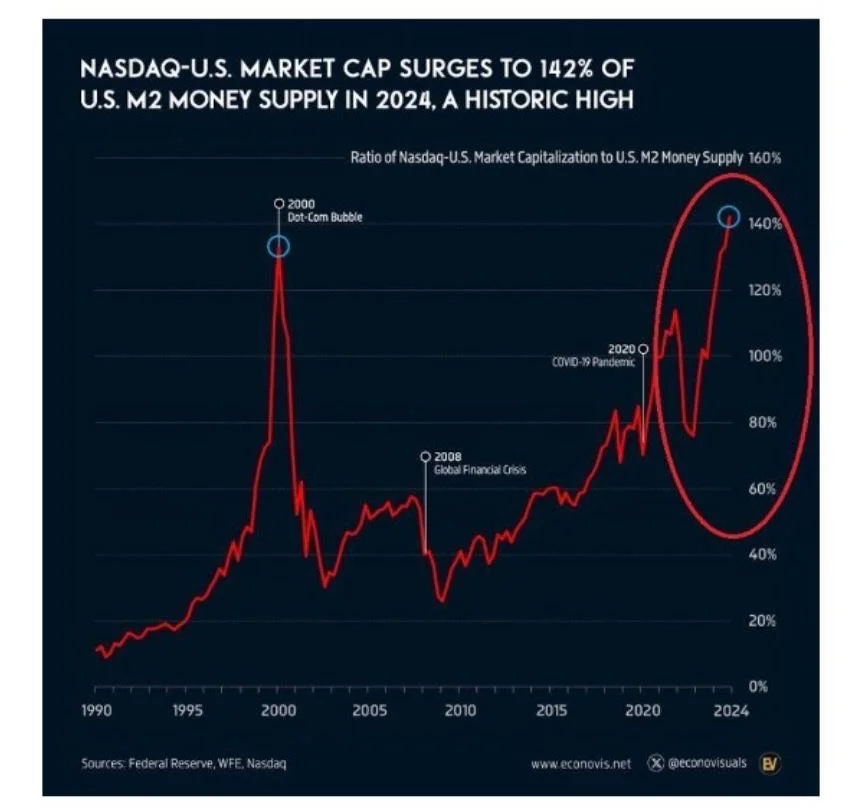
Nasdaq & Money Supply
The ratio of Nasdaq's market capitalization to the U.S. M2 Money Supply has reached a record 142%, doubling over the past five years and surpassing levels seen during the dot-com bubble (~130%). This indicates that the growth in equity markets has significantly outpaced the increase in money supply.
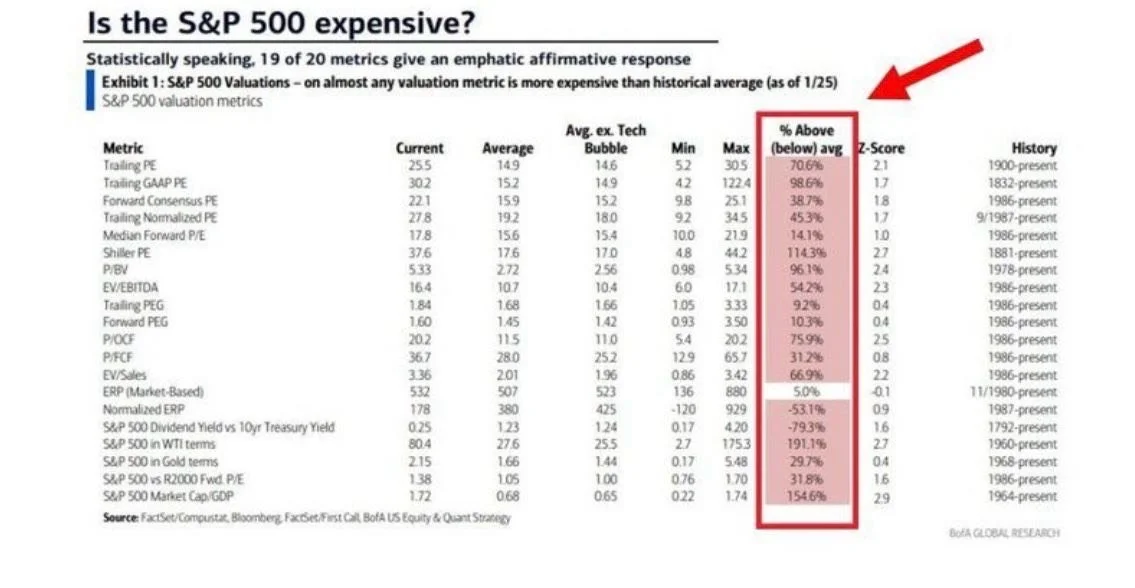
According to a Bank of America analysis, the S&P 500 appears overvalued on 19 out of 20 metrics. Notably, the Buffett Indicator (Market Cap to GDP ratio) exceeds historical averages by over 100%
S&P 500 Valuationcators
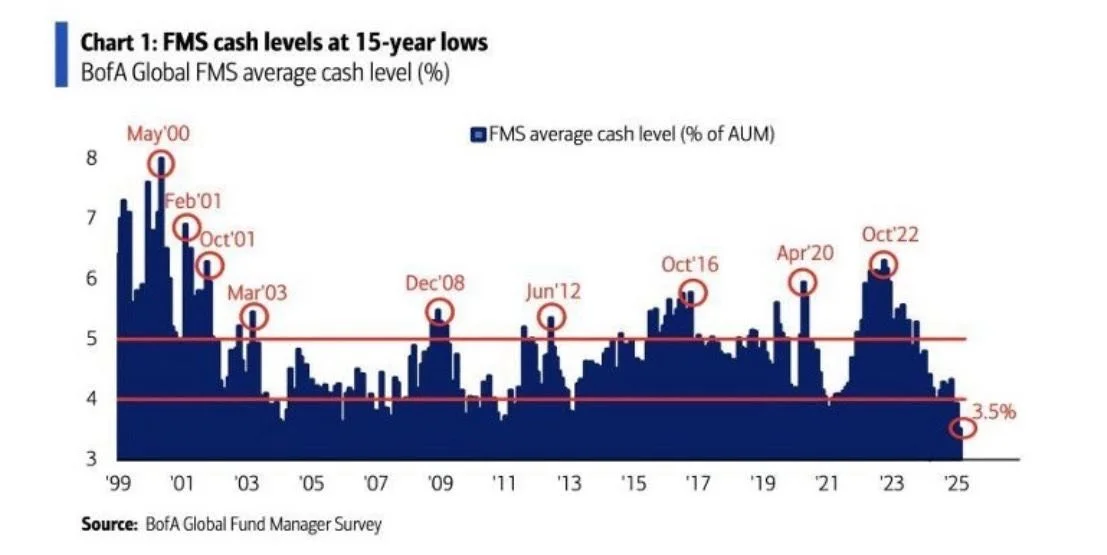
Investors are displaying strong bullish behavior, with cash allocations dropping to 3.5%, the lowest since 2010, as reported by the Bank of America Fund Manager Survey. This suggests a heavy investment in equities and reduced cash reserves.
Investor Cash Levels
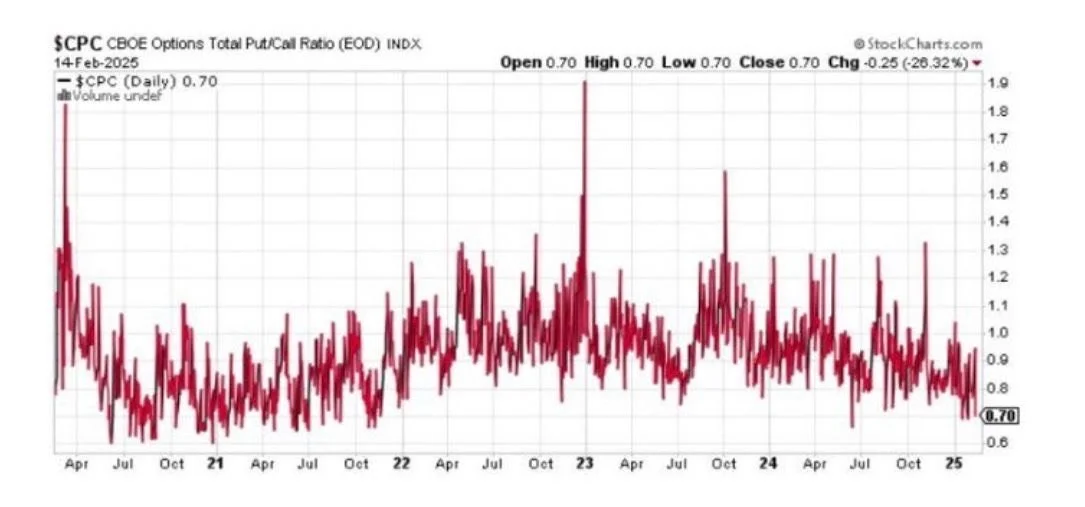
The 30-day moving average of the put-to-call ratio has fallen to its lowest point since November 2021, a month before the 2022 bear market began. This mirrors levels seen in February 2020, prior to the market crash, indicating a potential lack of hedging and possible market complacency.
U.S. Equities vs. options risk
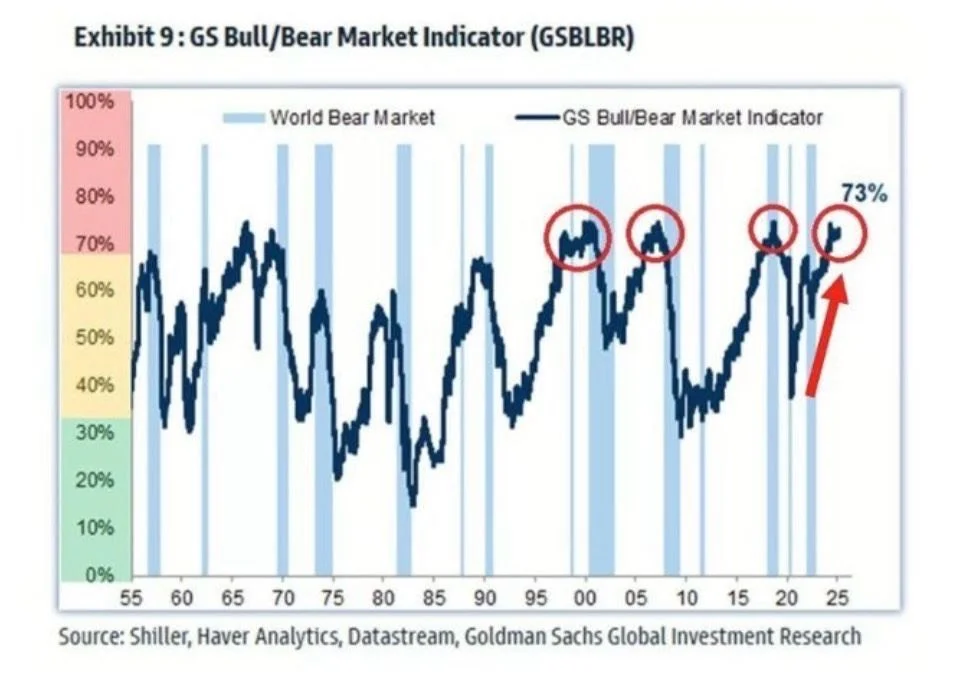
Goldman Sachs Bull/Bear Market Indicator, which assesses market and economic sentiment, has reached 73%, one of its highest readings historically. This aligns with previous peaks observed before bear markets in 1999, 2007, and 2020, suggesting heightened investor euphoria.
u.s. Equities & sentiment
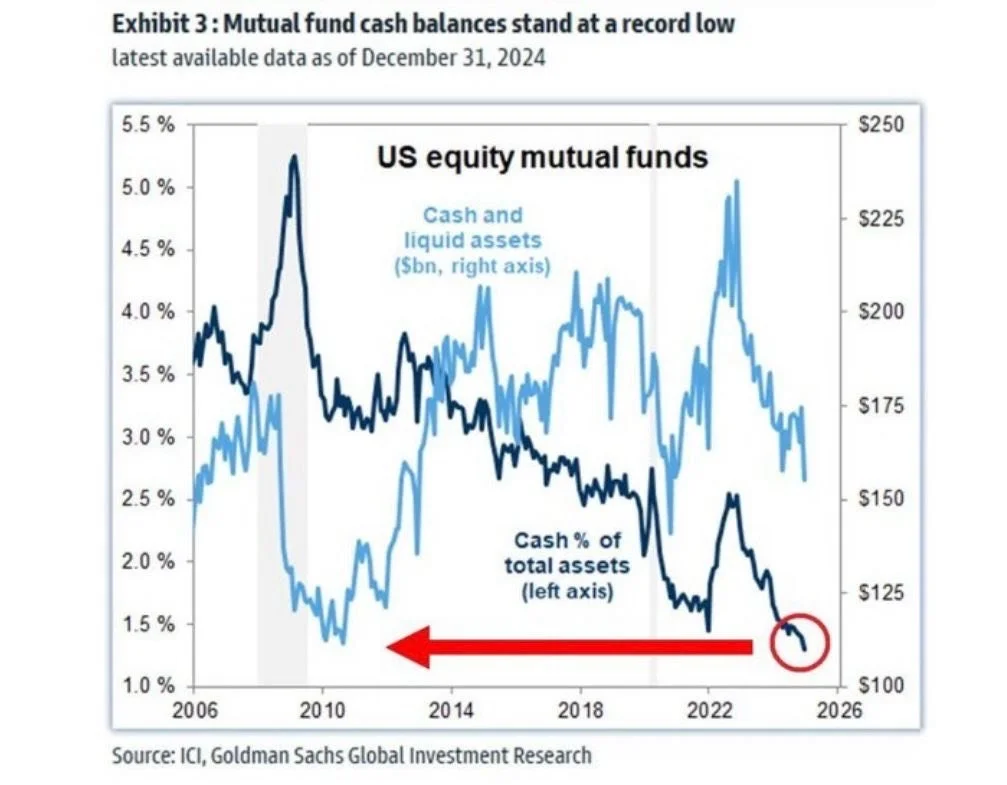
Cash holdings in U.S. equity mutual funds have declined to a record low of 1.3%, even lower than levels observed in early 2022 when the bear market commenced. This indicates limited liquidity available for further stock investments.
Is Cash Trash in this Market?
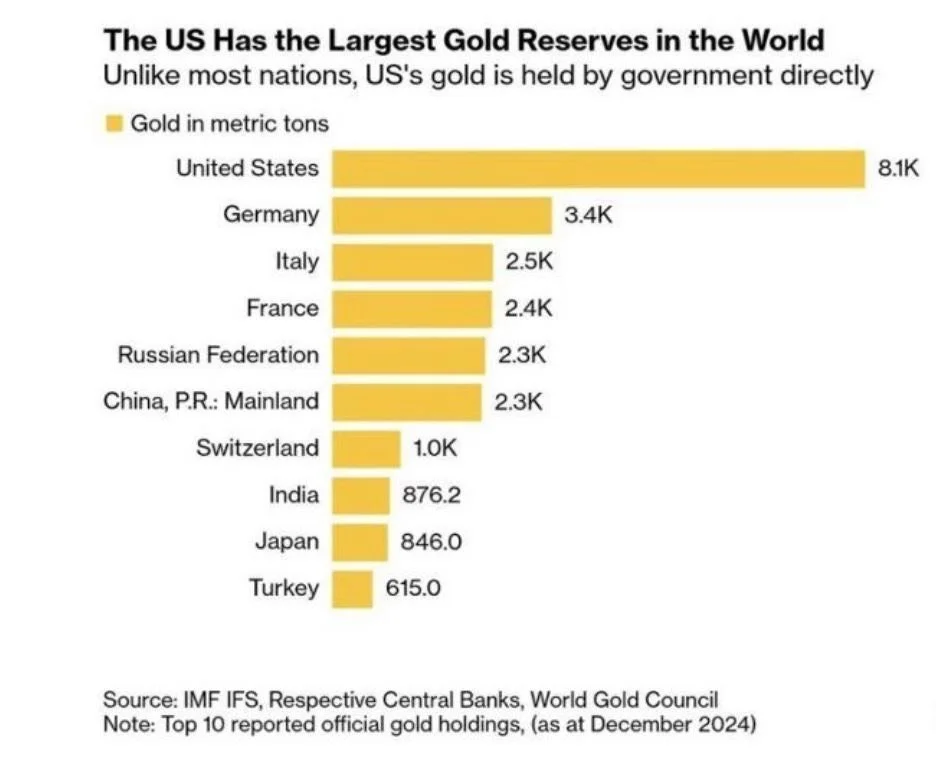
The United States maintains the largest gold reserves globally, surpassing the combined reserves of Russia, China, Switzerland, India, and Japan.
u.s. gold reserves
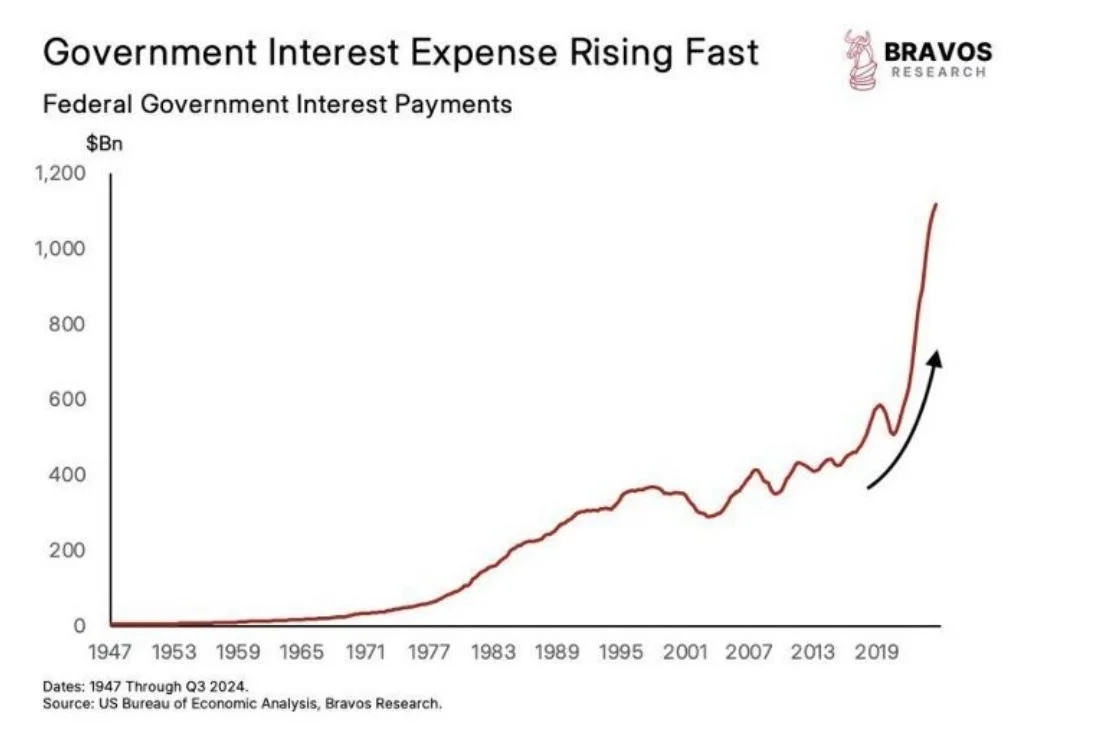
The U.S. government's interest expenses have escalated rapidly in recent years, now exceeding $1.1 trillion. Projections suggest this could reach $1.7 trillion by 2034, raising concerns about the sustainability of national debt levels.
U.S. Debt & Government Interest Expense
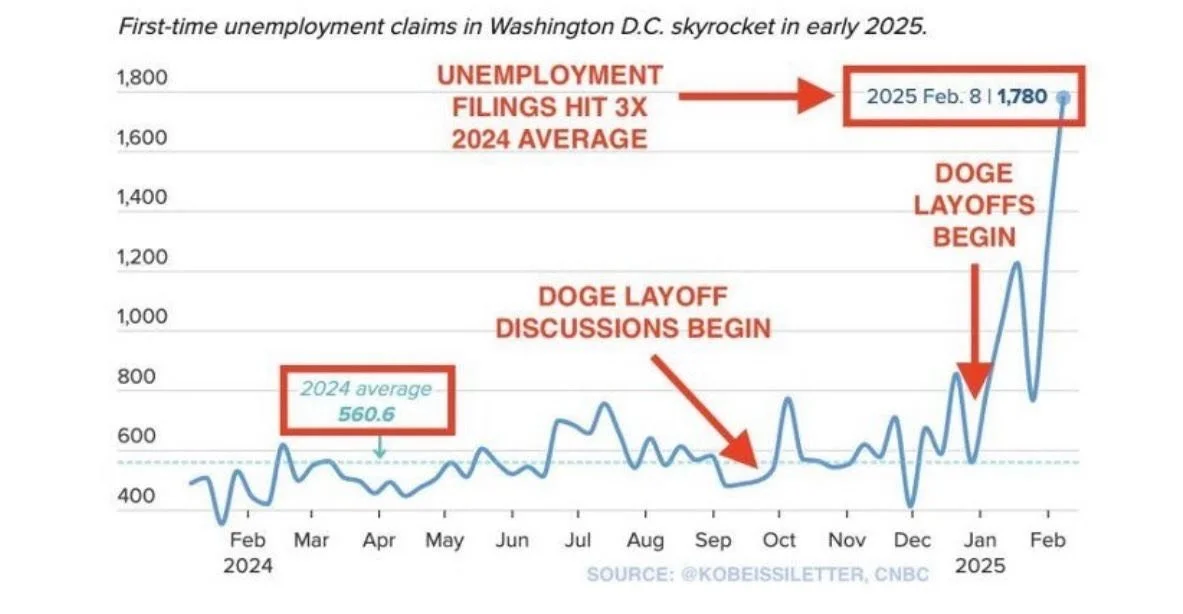
Unemployment claims in Washington D.C. have surged by 36% in a single week, tripling the average rate. Over the past six weeks, claims have increased by 55%, surpassing levels seen in 2008. Since January 20th, over 4,000 federal employees have filed initial unemployment claims, with the year-to-date total nearing 7,000 a 55% increase over the previous six-week period.
Washington D.C. Unemployment
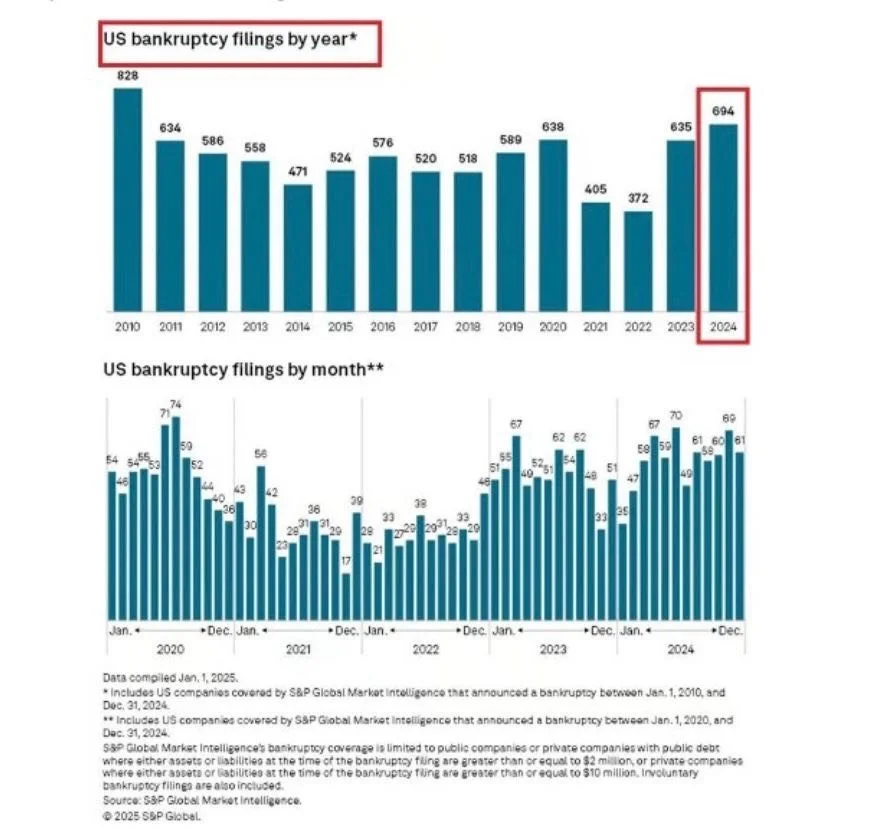
Large-scale bankruptcies in the U.S. are on the rise, with 70 filings in January, matching the highest monthly count since the 2020 crisis. In 2024, bankruptcies totaled 694, the most in 14 years, indicating a trend reminiscent of economic downturns.
U.S. Bankruptcies
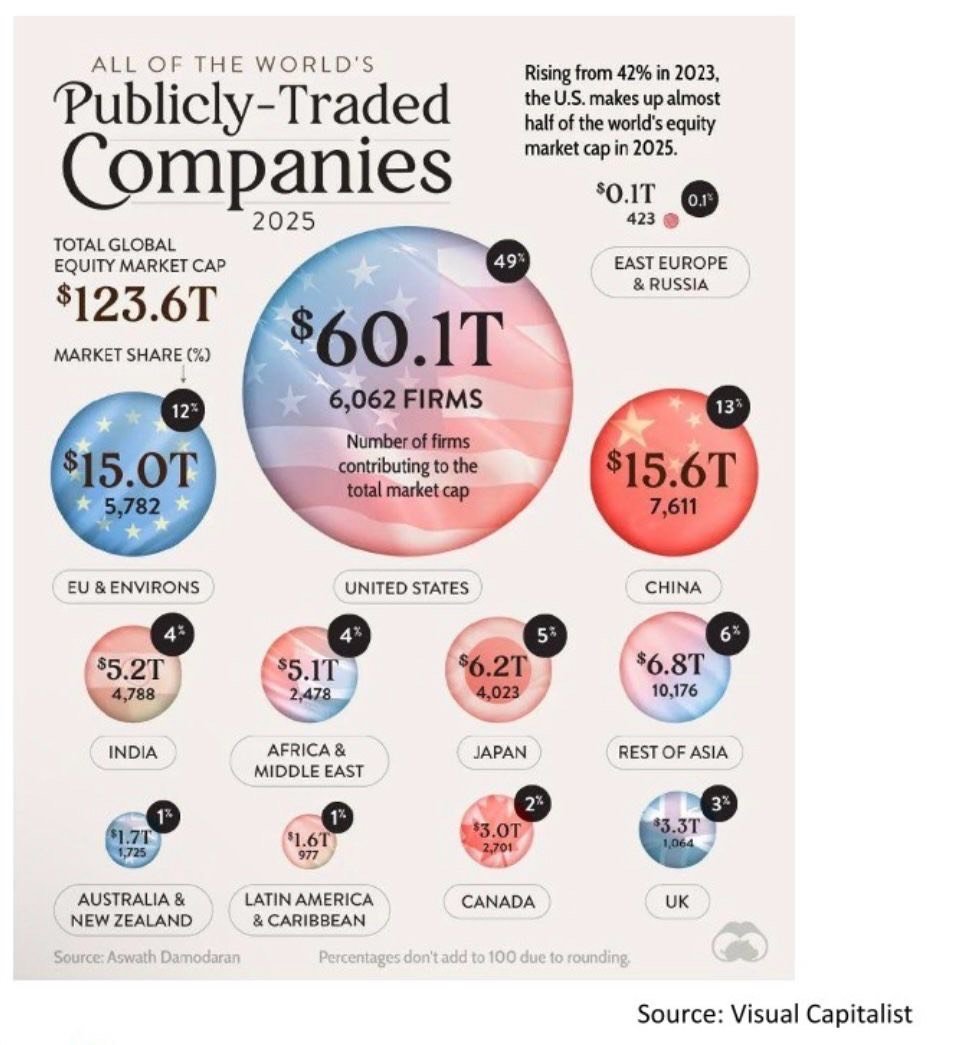
The United States accounts for nearly half of the world's stock market capitalization, underscoring its significant influence in global equity markets.
U.S. Dominance in Global Stock Markets
Market Recap 02/9/25
U.S. stocks ended the week lower as uncertainty over tariffs weighed on sentiment. While major indexes declined, the S&P 500 held up relatively well, slipping just 0.2%. Markets opened sharply lower following Trump's announcement of 25% tariffs on imports from Mexico and Canada and 10% levies on Chinese goods, set to take effect on February 1. However, by Monday's close, Trump postponed tariffs on Mexico and Canada for 30 days, helping stocks recover some early losses.
Earnings season also influenced sentiment, with 77% of S&P 500 companies that have reported Q4 results exceeding consensus earnings expectations, averaging 16.4% growth (vs. 11.9% projected). Additionally, 63% have surpassed sales estimates.
On the macroeconomic front, U.S. manufacturing activity expanded for the first time in 27 months, while the labor market showed signs of gradual cooling. Weaker-than-expected employment data helped drive demand for U.S. Treasuries, pushing yields lower across most maturities.
Treasury Secretary Scott Bessent says Trump 2.0 focusing on 10Year T Bond yields, not Fed. Bessent repeated his view that expanding energy supply will help lower inflation. For working-class Americans, "the energy component for them is one of the surest indicators for long-term inflation expectations," he said.
Globally, the pan-European STOXX 600 Index rose 0.6%, while Hong Kong's Hang Seng Index surged 4.5%, marking its best week in four months, fueled by gains in technology stocks. Gold climbed to another record high, while cryptocurrencies ended the week lower.
Tariff Uncertainty weighs on Stocks as bond yields drop
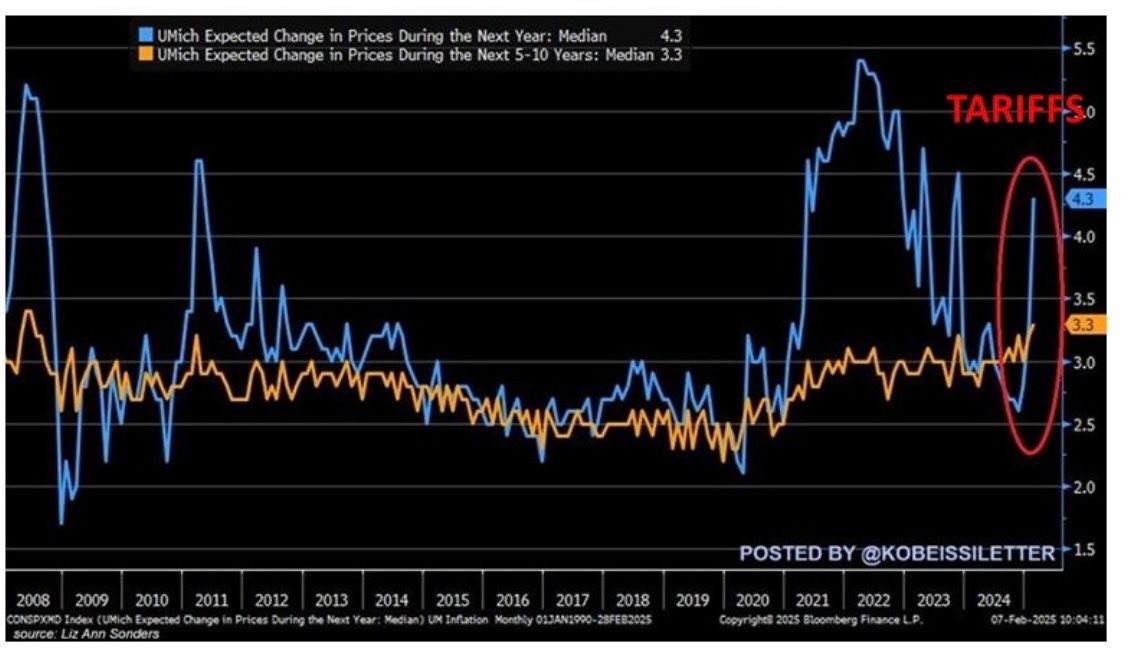
U.S. consumers' 12-month inflation expectations have jumped to 4.3%, the highest level since November 2023. This marks a sharp 1.7 percentage point increase over the past three months—the most significant surge since February 2020—and far above the expected 3.3%. Additionally, 5-10-year inflation expectations climbed to 3.3%, the highest since June 2008, surpassing forecasts of 3.2%. Inflation remains a pressing concern for most Americans.
Us Inflation Expectations Surge
Historic Market Valuations
Market valuations have reached record highs, considering multiple valuation methodologies.

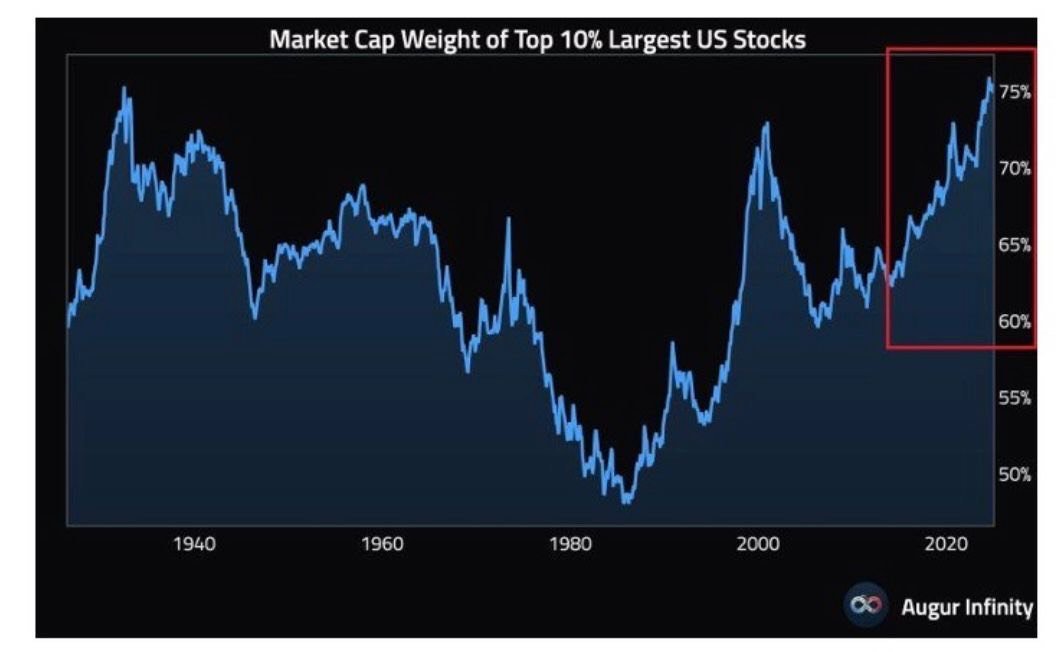
The top 10% of the largest U.S. stocks now account for an unprecedented 75% of total market capitalization, surpassing even pre-Great Depression levels. During the Dot-Com Bubble peak (2000), the share was slightly lower at 73%.
Extreme Market Concentration
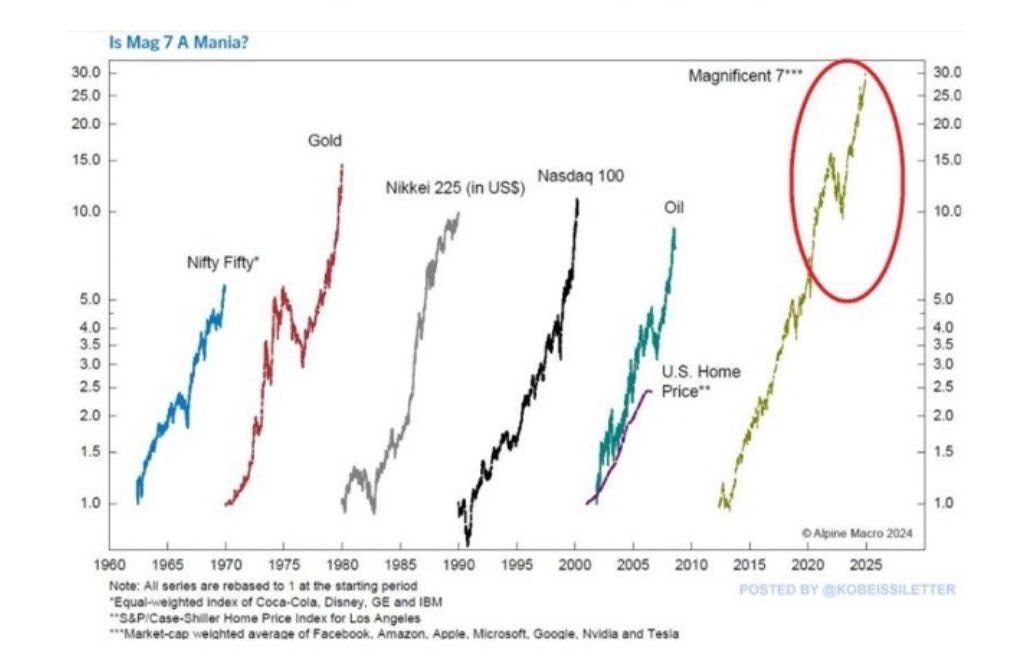
The Magnificent 7 stocks are now 30x higher than a decade ago, outpacing previous market bubbles:
Nasdaq 100 (Dot-Com Bubble, 2000): 12x increase over 10 years.
Nikkei 225 (Japan, 1980s): 10x increase.
Gold (1970s): 15x increase before peaking.
Nifty Fifty (1960s): 5x increase before the bull market ended in 1969.
Can AI sustain these historically high valuations?
A Bubble or the NExt Best Thing?
U.S. technology equity funds saw $7 billion in inflows last week, one of the largest in 14 months. Net positioning in mega-cap tech stocks remains at historically extreme levels.
Fear of Missing Out (FOMO) Drives Tech Surge

Leverage Mania
Trading volume in leveraged ETFs has surged, reflecting heightened risk appetite.

A key question looms: Will policymakers sacrifice equity markets to stabilize bond markets?
Will the U.S. Crash Stocks to Save Bonds?

Yield Curve Flattening
The yield curve saw a dramatic flattening this week, signaling economic uncertainty.


in 2024, the U.S. added $2.2 trillion in public debt to generate $570 billion in GDP growth. This equates to $3.9 of debt for every $1 of economic expansion.
U.S. Growth Fueled by debt
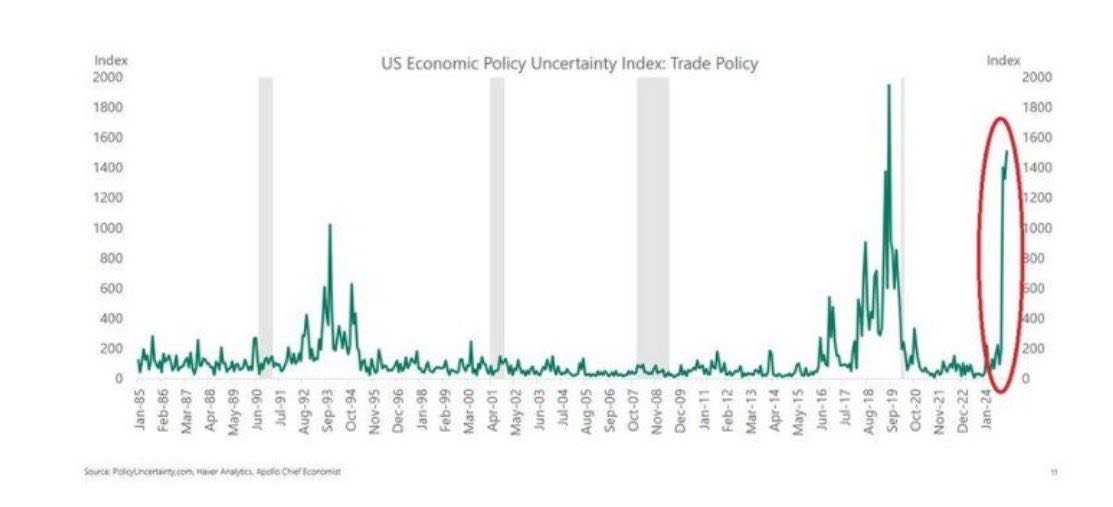
The Economic Policy Uncertainty Index is surging, indicating a more unpredictable investment environment and heightened market volatility, the highest level since the 2018 trade war.
U.s. Policy Uncertainty Spikes
In 2024, it took $3.8 of national debt to generate $1 of GDP growth.
Q4 2024 alone required $5.8 of debt per $1 of growth.
Without this borrowing, the U.S. economy would have been in a recession.
debt Bubble driving the economy

Canada & Mexico Strategic moves
Geopolitical and Market Realities. Recent events illustrate why both Canada and Mexico immediately conceded economically.

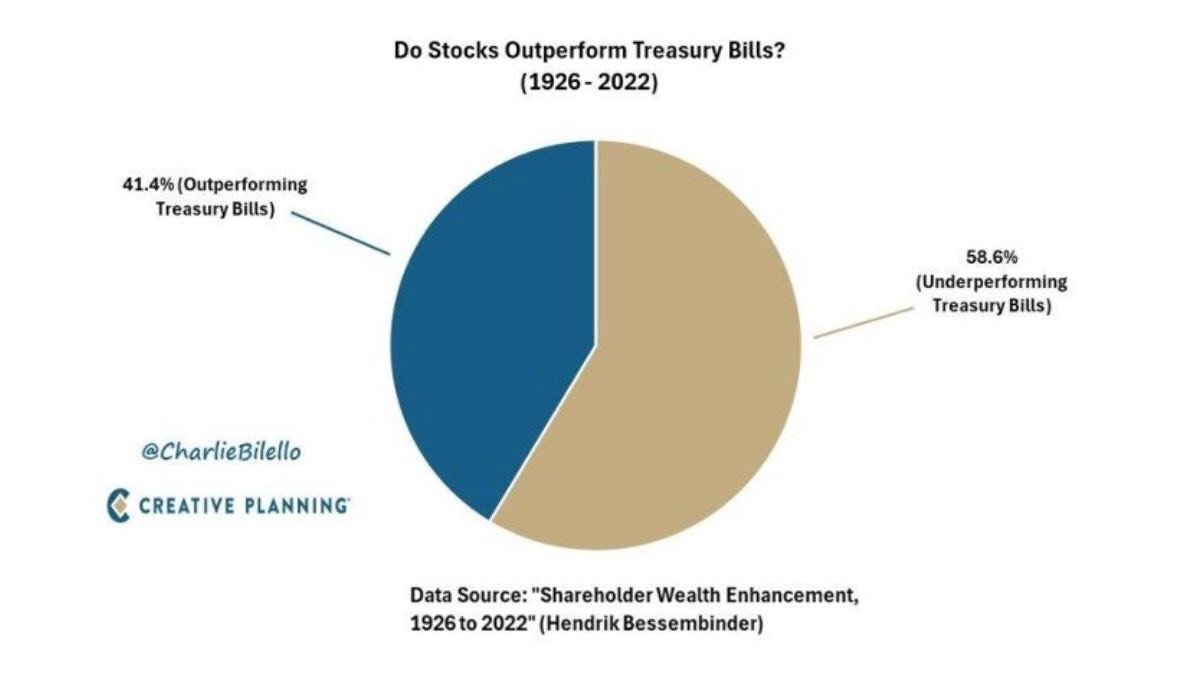
Historically, 95% of stocks have underperformed Treasury bills over their lifetime, with over half delivering negative cumulative returns.
Jack Bogle's advice - "Don't look for the needle in the haystack. Just buy the haystack."
stock performance vs. treasury bills
Market Recap 01/11/25
U.S. equities declined last week, with small-cap stocks underperforming large caps for the fifth time in six weeks, as the Russell 2000 Index slipped into correction territory. Value stocks fared better than growth stocks, while the Nasdaq Composite posted its steepest weekly drop since mid-November, falling 2.34%.
The week began positively, driven by reports suggesting a softer tariff stance from the incoming Trump administration. However, optimism faded as President-elect Trump dismissed these reports, and economic data reignited inflation concerns. On Friday, a blowout jobs report revealed the U.S. economy added 256,000 jobs in December, far surpassing expectations of 155,000. The data sent stocks sharply lower and solidified weekly losses across major indexes.
U.S. Treasury yields rose throughout the week, with the benchmark 10-year yield hitting its highest intraday level since November 2023 following the payroll report. In addition, 10-year Treasury auction yielded 4.68%, the highest level since 2007.
In commodities, oil surged on Friday, supported by new Russian sanctions and colder weather. The pan-European STOXX Europe 600 Index gained 0.65% for the week, while Japan’s Nikkei 225 fell 1.8%. Despite a strong U.S. dollar, gold rebounded to near $2,700, and Bitcoin remained volatile, testing the $91,000 level.
Good Macro News Spells Trouble for Bonds and Stocks
BoA (Hartnett): “U.S. Treasuries are entering the 6th year of the 3rd Great Bond Market of the past 240 years due to global shift to populism, rising U.S. government debt, inflationary central banks. Recession and/or default needed to reverse the secular bond bear of the 2020s.
U.S. Treasuries entering the 6th year of the 3rd Great Bond Market


Breadth is critical, and the current state of equities is concerning. This chart shows the percentage of stocks outperforming the S&P 500, which has hit all-time lows. In other words, concentration risk—measured this way—now surpasses the lows seen in 2000.
Equity Breadth Hits Record Lows
S&P 500 Dividend Yield Falls to 23-Year Low

The S&P 500’s dividend yield has dropped to 1.27%, matching Q4 2021 as the lowest level since 2000.
Goldman Sachs reports that U.S. valuations are at a 20-year peak, even when excluding the largest technology companies.
U.S. valuations are at a 20-year peak

China Enters Bear Market as MSCI Index Drops 20%
China has officially entered a bear market, with the MSCI China Index plunging over 20% from its recent highs and now testing the 200-day moving average.

Record-High Correlation Between U.S. Stocks and Bonds

The correlation between U.S. stocks and bonds over the past three years (0.73) is the highest ever recorded.

Inflation expectations are surging, with the 10-year breakeven rate reaching its highest level since October 2023.
Surging inflation expectations
Widest gap between 30-YEAR TREASURY AND S&P 500 YIELDS

The U.S. 30-year Treasury now yields 366 basis points more than the S&P 500, marking the widest gap since 2004.
UK 10-YEAR YIELDS reach the highest level since august 2008
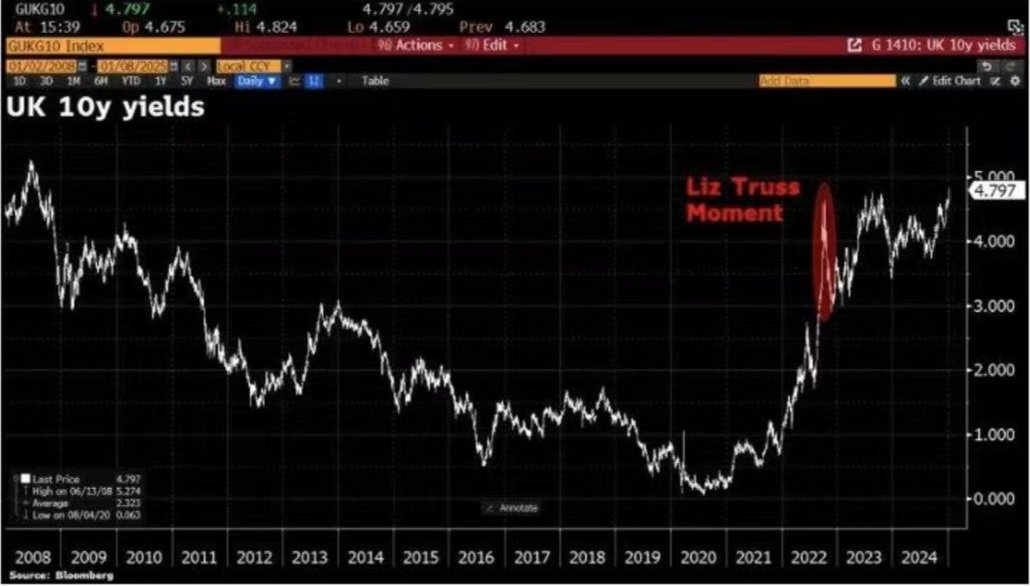
UK 10-year yields climbed by as much as 14 basis points to reach 4.82%, the highest level since August 2008.
Consumer credit card debt has just experienced its steepest drop since the onset of COVID—historically a concerning signal that often precedes or coincides with deep recessions. According to the Fed’s latest consumer credit data, U.S. household credit in November fell by $7.5 billion to $5.102 trillion, representing a 1.8% annualized contraction—a trend typically seen during significant economic downturns.
deepest drop of consumer credit card debt since covid

Stock-picking hedge funds have posted their highest average returns since 2020, according to Goldman Sachs. In 2024, global hedge funds achieved their best average returns, with a weighted average of 12.75%, while gross leverage increased to 190%, compared to the S&P 500’s 20% rise. Systematic equity funds led the pack, generating a 20% return through the use of algorithms.
Stock-Picking Hedge Funds See Best Returns Since 2020
